A status page without the complexity
No monitors to configure. No integrations to wire up. Create a simple status page for a few services or a large manual service directory, update component statuses from one dashboard, and keep users informed with context-rich notes.
Everything you need, nothing you don't
From a few components to large manual service pages, tell users what's affected without setting up monitors.
Up and running in minutes
Create a status page, add your services as components, and share the link. No monitors, no agents, no infrastructure required.
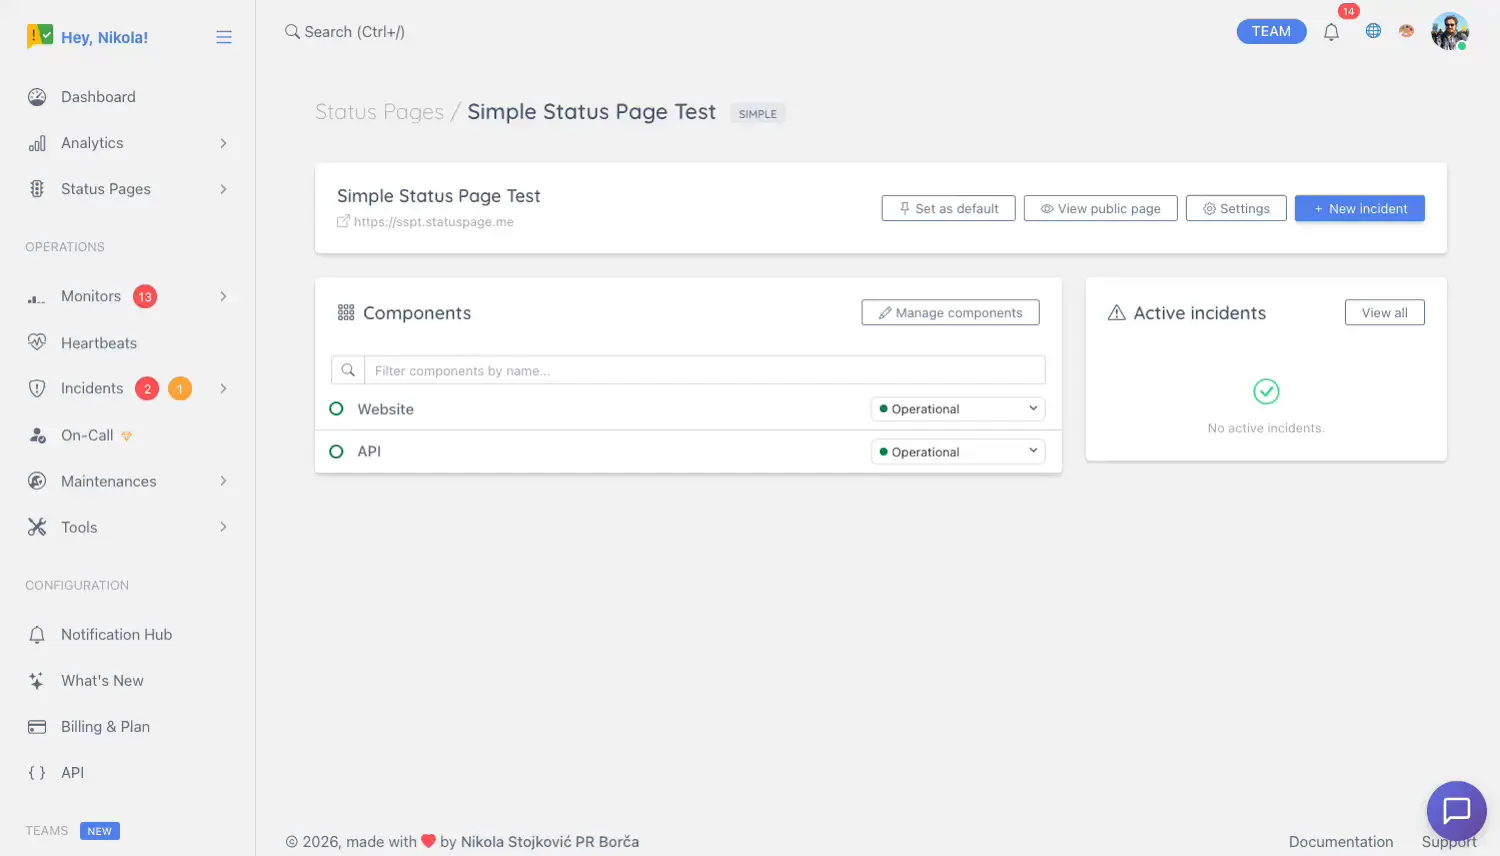
One-screen control panel
The Simple Dashboard puts everything in one place — component statuses, active incidents, and quick updates. No navigating around, no settings pages.
Add context with notes
When changing a component's status, add an optional note (e.g. "Investigating elevated error rates"). It shows publicly next to the component — and automatically creates an incident record.
Subscribers notified automatically
When you add a note to a status change, your page's subscribers are notified automatically — no separate incident to create, no extra steps.
90-day reported history
Every component shows a 90-day strip of reported status — green for operational days, coloured ticks for incidents, overrides, or maintenance. A transparent record for your users.
Upgrade when you're ready
Start simple and add automated uptime monitoring, custom domains, branding and incident management as your product grows.
See the all-in-one platform when you're ready to combine monitoring, incidents, and status pages.
Three steps to a live status page
No guides needed. No technical setup. Just fill in the blanks.
Create your status page
Choose "Simple Status Page" when creating a new page. Give it a name - it's ready instantly.
Add your components
Add the services, APIs or features you want to track - for example "API", "Dashboard", "Auth". Each becomes a row on your public page.
Update from your dashboard
When something changes, open the Simple Dashboard, pick a status and add an optional note. Your public page updates instantly — and subscribers are notified if you included a note.
Update status in two clicks
The Simple Dashboard is your home base for the page. Every component is listed with its current status and note. Click edit, pick a state, optionally add a note, and save — done.
- See all component statuses and active incidents at a glance
- Pin it as your default landing page for instant access after login
- No navigating around settings — everything is right there
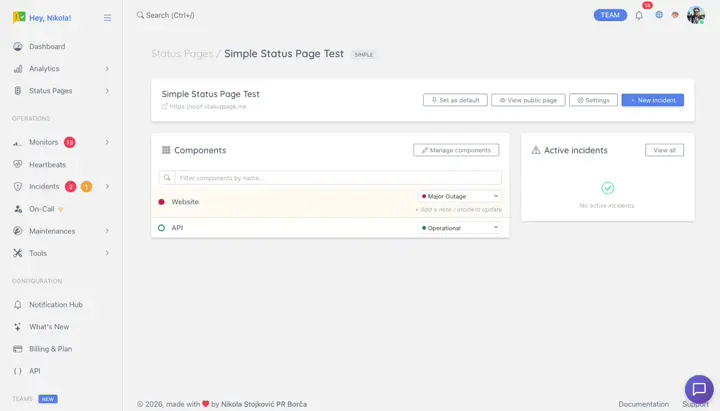
Notes shown publicly · Incident created automatically
One note does three things
When you add a note alongside a status change (e.g. "Investigating elevated error rates"), the platform automatically shows it next to the component on your public page, creates an incident record in your history, and notifies subscribers — all from a single form.
- Note appears inline on the public status page
- Incident entry created automatically — no separate step
- Subscribers notified without opening the incident management flow
- Incident auto-resolves when you reset the component to Operational
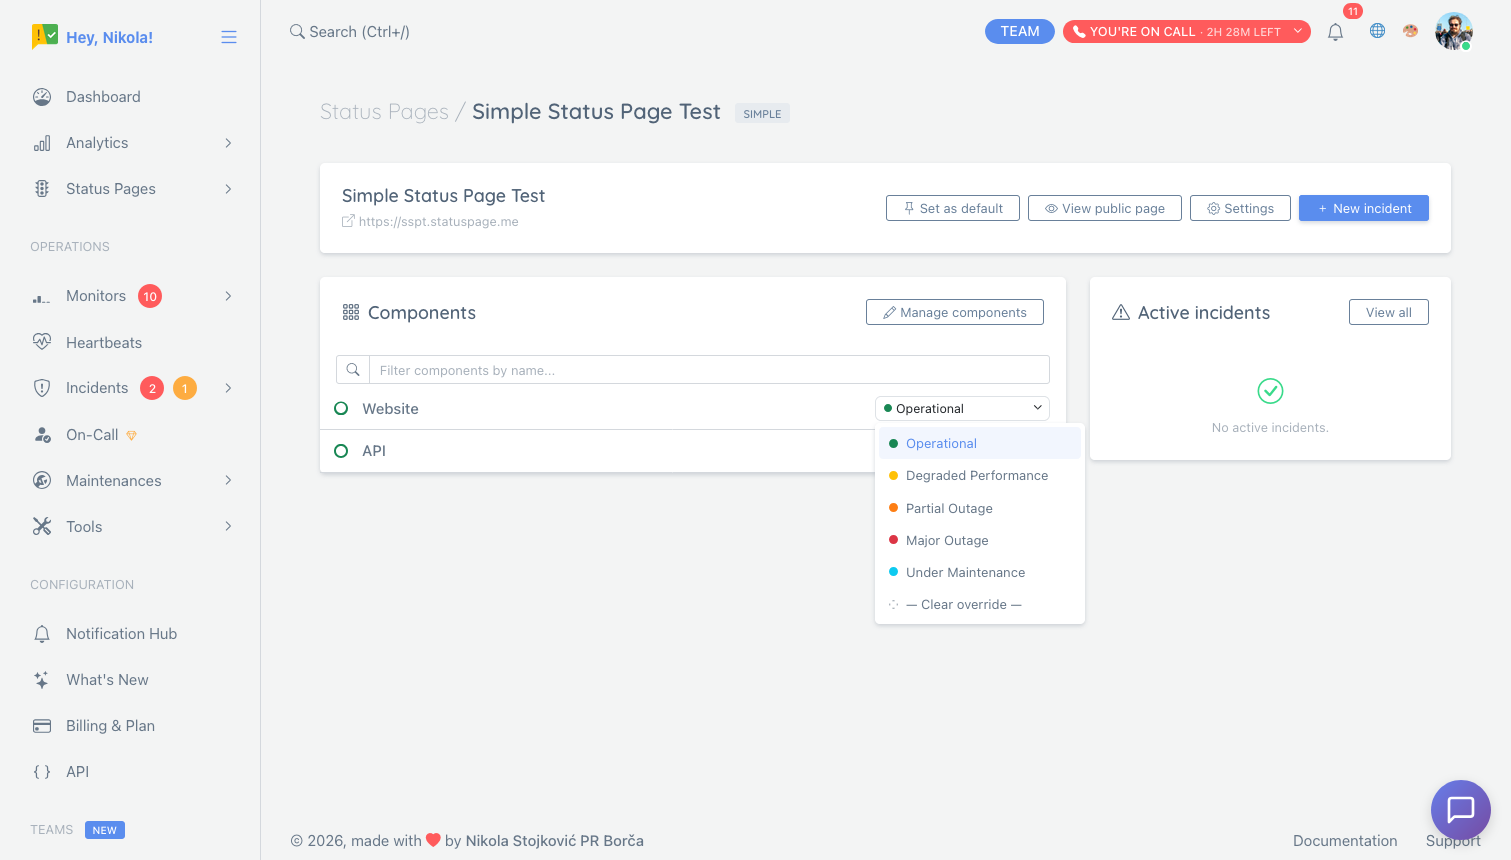
Five status states, clearly communicated
Each component on your page can be set to one of five states that visitors instantly understand - no jargon, no ambiguity.
- Operational Everything is working normally
- Degraded Working but slower or partially broken
- Partial Outage Some users are affected
- Major Outage Service is down for most users
- Maintenance Planned work in progress
Built for large manual status pages too
Simple status pages are not only for small products. Use them for large component-based pages where teams manually report the status of regions, vendors, service categories, internal dependencies, or customer-facing surfaces.
- Group components by product area, region, vendor, infrastructure layer, or workflow.
- Collapse healthy groups so visitors are not forced through a wall of green components.
- Use Large Layout Mode when many groups need compact accordions and an affected systems summary.
- Keep monitor-backed pages on the default layout when response time graphs and uptime charts matter.
Who uses simple status pages?
Any team that wants to communicate service health without automation.
Startups in early access
You have a handful of early users and want to show them you take reliability seriously, but you're not ready to invest in full monitoring infrastructure.
- Add components for your API, dashboard, and auth service
- Update status with a note from the dashboard during incidents
- Share the URL in your app footer
Internal tools & admin panels
Your internal systems don't face public users, but your teammates still need to know when things are broken or in maintenance.
- List internal services as components
- Set maintenance status before scheduled downtime
- Share with your team on Slack
Operations and vendor-heavy teams
You manage many services, regions, suppliers, or customer-facing workflows and need a page people can scan quickly.
- Group components like Payment Providers, Email Delivery, and Europe
- Keep healthy groups collapsed so affected systems stand out
- Use notes and maintenance states when updates are manual
Ready to keep your users in the loop?
Create a free simple status page in under two minutes. No credit card required.
Create Your Status Page - Free