
Server Agent: Host Metrics Monitoring
Updated: 2026-08-04
The Server Agent is a small binary you install on your own machines to collect host-level metrics — CPU, memory, swap, load average, disk, and network — and see them on a dedicated dashboard, alongside your monitors and incidents.
Unlike regular monitors (which check a URL from the outside), the Server Agent runs on the host itself and reports what it sees from the inside.
When to use it
Use the Server Agent for:
- Watching resource pressure on servers that back your monitored services (database boxes, app servers, workers)
- Catching a slow memory leak or disk-fill-up before it takes a service down
- Correlating a host running hot with an incident that happened around the same time
If you need to check that a website or API is reachable, use a regular monitor instead. If you need to confirm a scheduled job actually ran, use a heartbeat monitor.
Installing the agent
- Go to Servers in the dashboard and click Add server.
- Give it a name (a label for you — the agent’s own hostname is separate, optional, and can be changed or cleared later).
- Creating the server returns a one-time install command:
curl -fsSL https://statuspage.me/install-server-agent.sh | sudo bash -s -- \
  --server-id <server-id> \
  --ingest-key <ingest-key>
Run that on the target host. The --ingest-key is shown exactly once at creation time and cannot be retrieved later — copy it before closing the dialog. If you lose it, regenerate a new one from the server’s Settings.
The agent is open source: github.com/hosted-status-page/hsp-server-agent. Read the install script and the agent’s source before piping it into sudo bash, same as you should for any curl-to-shell install.
Metrics typically appear on the dashboard within a couple of minutes of a successful install.
Metrics collected
The agent reports, on a regular interval:
- CPU — user and system utilization
- Memory — used and total bytes
- Swap — used and total bytes (shown as “—” if the host has no swap configured)
- Load average — 1, 5, and 15 minute averages
- Disk — used and total bytes, read/write throughput
- Network — inbound/outbound throughput
- OS — a human-readable distro/version string (e.g. “Ubuntu 22.04.4 LTS”), shown in the header for your own reference. Display only — never shown on a public page.
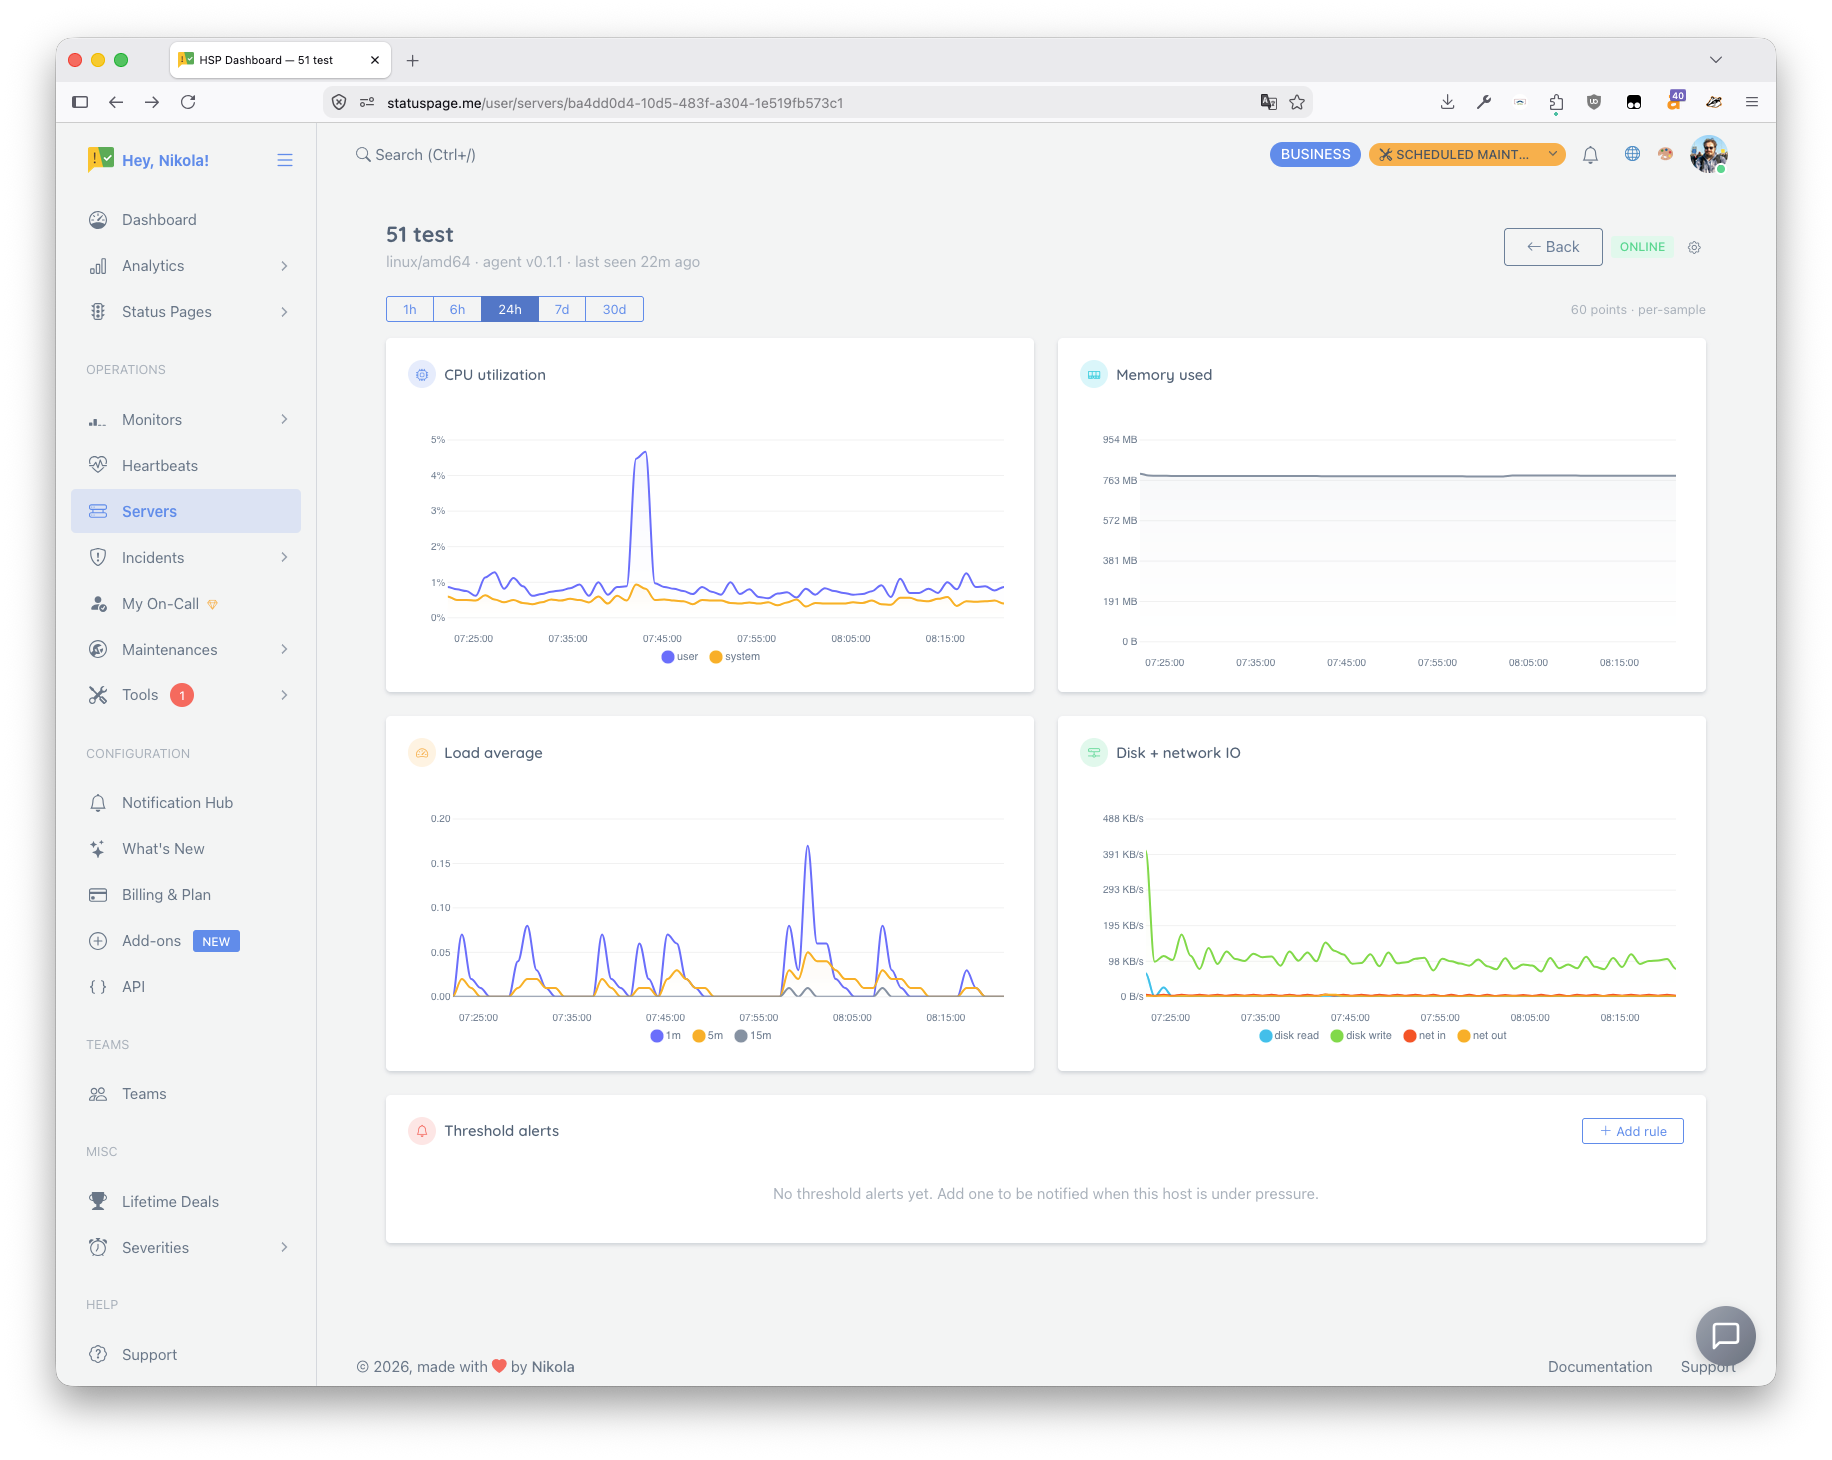
Each metric has its own card on the server’s detail page — a large current value with a chart underneath — and a range dropdown (Last hour / 6 hours / 24 hours / 7 days / 30 days) to zoom in or out. How far back you can look depends on your plan’s metrics retention window.
A Recent metrics table underneath the cards summarizes all six metrics at once: current value, percentage change over the last hour, and a small trend sparkline. The change column is colored by how large the swing is, not by direction — a rising value isn’t automatically shown as “bad” (red) or a falling one as “good” (green), since that’s backwards for some metrics and not meaningful for others.
Dashboard
Server list (/user/servers)
Every server you’ve added shows as a card with its current status, at-a-glance CPU/memory/load, and when it was last seen. A quota indicator at the top shows how many of your plan’s server slots are in use.
Status meanings:
- Online — reporting normally
- Stale — hasn’t reported in a while, but not yet considered down
- Offline — stopped reporting
- Pending — added, but no report received yet
Server detail (/user/servers/:id)
Click into a server to see its full metric charts, configure threshold alerts, and open Settings.
If a server is linked to the exact monitor that checks a target backed by it, that monitor’s incident windows are shaded directly on its metric charts — useful for spotting “was this host struggling when that target failed?” at a glance. See Linking a server to a status page below.
Threshold alerts
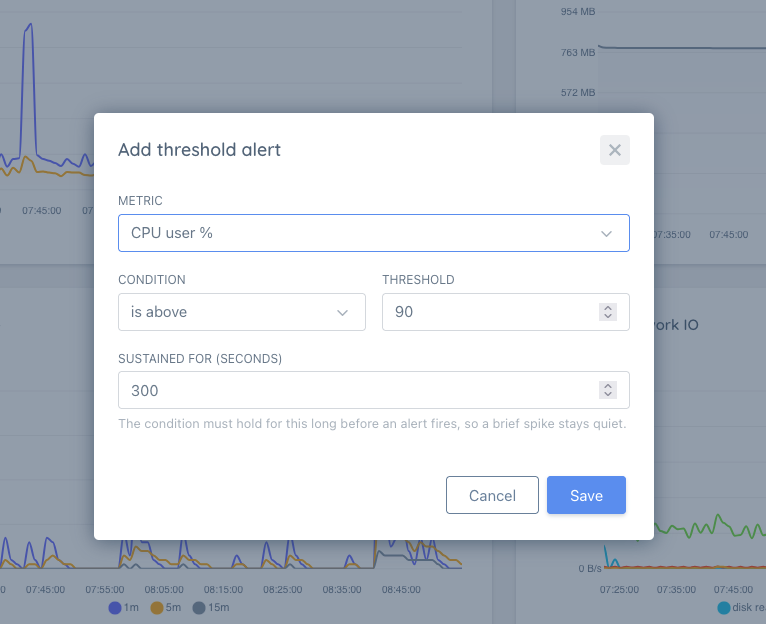
On a plan that includes server alerts, you can add threshold rules from a server’s detail page: pick a metric (e.g. cpu_user_pct, mem_used_bytes, swap_used_bytes, load1, disk_used_bytes, net_rx_bps), a condition (above / at or above / below / at or below), a threshold value, and how long the condition must hold before it fires (so a brief spike stays quiet).
A rule shows Firing while its condition is met, OK once it clears, or Disabled if you’ve turned it off. Alerts are sent through the same internal notification channels used for your monitor and heartbeat alerts.
If your plan doesn’t include server alerts, the detail page shows an upgrade prompt instead of the “Add rule” button.
Server settings
Open a server and click the gear icon to manage it:
- Name, hostname, description — edit anytime. Hostname is self-reported by the agent and may carry a machine’s real name; clear or edit it if you’d rather not keep that.
- Enabled — turn off to pause metrics collection without deleting anything.
- Status Page / Component group / Component / Monitor — see Linking a server to a status page below.
- Regenerate ingest key — issues a new key and immediately invalidates the old one. You’ll need to update the key in the agent’s config on the host.
- Delete — permanently removes the server and all its recorded metrics. This cannot be undone.
Linking a server to a status page
From the same Settings panel:
- Status Page — choose the status page that contains the monitor you want to correlate. This establishes selection context; it does not by itself put incidents on the server charts.
- Component group, then Component — narrow the picker to the customer-facing component that contains the monitor. A component can include several monitors for different targets, so this is not enough to identify a server.
- Monitor for incident correlation — select the exact monitor whose target is backed by this server, then explicitly confirm the link. The server charts show only incidents created for that monitor. This avoids falsely implying that an incident for another target in the same component affected this host.
With a component selected, the Show in Infrastructure on the status page toggle controls public display. When it is on and your plan includes public host metrics, a small “Infrastructure” card appears on the status page showing that component’s CPU, memory, and disk usage. Only the component name is shown — never the server’s own name, hostname, or IP. Without that plan entitlement, the component is still available for private monitor selection; the public card remains off.
A linked server can expose public metrics only when its plan permits it and a component is selected. Incident correlation remains private and requires an explicitly linked monitor.
The status page’s own Settings → Servers tab lists every server linked to it, each tagged Public or Correlation only, with a link back to that server’s Settings to change or remove the link — editing always happens from the server’s side.
Plan limits
Server Agent capacity depends on your plan:
- Server count — how many hosts you can add
- Metrics retention — how far back historical metrics are kept
- Threshold alerts — whether you can configure alert rules
Check Billing & Plan for your current limits.
Updating the agent
The dashboard shows an Update available badge next to any server running an
older agent than the current release. The agent never updates itself — it checks
for a newer version and logs it, nothing more — so updating is a manual step:
- Re-run the exact install command you used originally. It’s safe to run
again: it downloads the current release, overwrites the existing binary, and
restarts the service — it does not create a duplicate server or reset any
history. - Don’t have that command anymore? The ingest key inside it was shown only
once at creation time, so if it’s gone, open the server’s Settings and
click Regenerate ingest key. That gives you a brand-new one-time install
command for the same server (same ID, same history) — run it the same way.
There’s no separate package-manager install path today — Linux only, via the
install script above.
Troubleshooting
- “No data for this range” right after install: give it a couple of minutes for the first report to arrive, then try a shorter range.
- A server shows Stale or Offline: check that the agent process is still running on the host and that outbound HTTPS to your StatusPage.me instance isn’t blocked.
- Lost the ingest key: you can’t retrieve the original — regenerate one from Settings and update the agent’s config on the host. See Updating the agent above — the same steps also cover a routine version update, not just a lost key.
- Install command 404s: make sure you’re using the exact command shown when the server was created — it’s tied to that server’s ID and key.
Security notes
- The ingest key authenticates the agent to your account — treat it like a password, and avoid logging it in CI/CD output.
- Hostnames are self-reported and may contain personal information (a machine named after a person, for example); they’re never shown on a public page and can be edited or cleared at any time.
- The OS/distro string (e.g. “Ubuntu 22.04.4 LTS”) describes the machine’s software, not a person — it’s never shown on a public page.
- Regenerate the ingest key immediately if you suspect it leaked.
- The agent’s source is public: github.com/hosted-status-page/hsp-server-agent. Nothing it collects or sends is hidden from you.