Down Prediction Alerts
Last updated: 2026-04-14
Most monitoring tools only alert you after a service goes down. Down Prediction is a proactive feature that watches for a consistent upward trend in response times and alerts you while the monitor is still technically up — giving you time to investigate and act before an outage occurs.
How It Works
Down Prediction runs two complementary detectors after every monitor check:
Gradual degradation (trend detection)
The monitor maintains an in-memory ring buffer of recent response times. When the buffer is full, it runs a linear regression over the samples:
- Slope ≥ 1% of baseline per check — response times are meaningfully and consistently climbing, not just drifting by a few milliseconds
- R² ≥ 0.45 — the increase is a real trend, not random scatter (coefficient of determination)
- Current response time ≥ 1.5× the 30-day baseline — the service has already degraded measurably
When all three conditions are met, a “Possible downtime approaching” warning is sent through all your configured notification channels (Slack, Discord, email, webhooks, etc.).
Sudden spike detection
In addition to gradual trends, the detector watches for sudden jumps — a response time that is ≥ 3× the baseline in a single check, when the previous samples were normal. This catches cases where a service degrades instantly (or times out) rather than gradually.
Spike detection runs even when the monitor reports a down status, so a service that jumps straight from healthy to failing is still caught.
To avoid alerting on transient blips that self-resolve within a single check cycle, a spike notification is only sent after the elevated response time has persisted for at least 30 seconds. If the response normalises before that window elapses, no alert is sent. This means:
- On a 30-second interval monitor, the spike must still be present on the very next check.
- On a 60-second or slower monitor, the confirmation check naturally falls after the 30-second window, so the behavior is equivalent to one confirmation check.
The analysis runs on every check at negligible cost — it’s pure in-memory math with no extra database queries. Only the notification is rate-limited (default: once per 15 minutes per monitor).
StatusPage’s Down Prediction is designed to give you a heads-up on potential outages, so you can investigate and mitigate before your customers are impacted. It’s not a crystal ball, but it can catch many common degradation patterns early.
Prerequisites
Down Prediction is available on Team, Business, and Enterprise plans.
If you’re on a lower plan, you’ll see a locked notice on the monitor settings page with a link to upgrade.
How to Enable
- Go to Monitors in your dashboard
- Open an existing monitor (Edit) or create a new one
- Scroll to the Down Prediction Alerts section
- Toggle Enable Down Prediction Alerts on
- Optionally adjust the Analysis window (see below)
- Save the monitor
If you are still creating the monitor itself, start with Setting Up Your First Monitor.
Configuring the Analysis Window
The analysis window controls how many recent checks are used to evaluate the trend.
| Setting | Effect |
|---|---|
| 3–5 checks | Very sensitive — fires quickly but may produce more false positives on noisy endpoints |
| 10 checks (default) | Balanced — good for most monitors checking every 1–5 minutes |
| 20–30 checks | Conservative — only fires on sustained, long-running degradation |
A larger window gives you more confidence in the trend but means the alert fires later. For monitors checking every minute, a window of 10 = 10 minutes of trend data before alerting.
What Triggers an Alert
Degradation alert
Fires when all of the following are true simultaneously:
- The last N response times show a consistent upward slope (slope ≥ 1% of baseline per check)
- The R² value is ≥ 0.45 (the trend is not random scatter)
- The current response time is at least 1.5× your monitor’s 30-day average baseline
Spike alert
Fires when all of the following are true:
- Current response time is ≥ 3× the 30-day baseline
- Current response time is ≥
max(1.8× baseline, 400 ms)in absolute terms (filters sub-second jitter on very fast services) - The previous sample was within 2× the baseline (confirming the jump was sudden, not a continuation of an already-elevated state)
- The elevated response has persisted for at least 30 seconds (see Spike persistence gate above)
The baseline is automatically computed from your historical aggregation data and refreshed daily.
Alert Content
Both alerts make clear this is a predictive warning, not confirmed downtime:
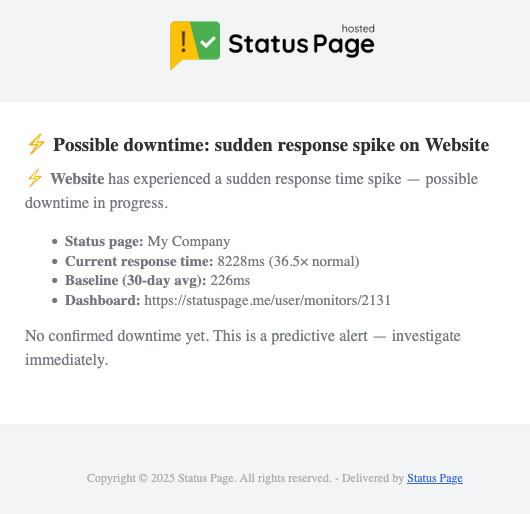
- Subject: “Possible downtime approaching: …” or “Possible downtime: sudden response spike on …”
- Current response time (and ratio to baseline for spikes)
- Your 30-day baseline average
- Trend slope (degradation alerts only, e.g. “+45ms per check”)
- A direct link to the monitor dashboard
No confirmed downtime has occurred when this fires — investigate now before it becomes an incident.
Here’s an example of a sudden response time spike detection email:
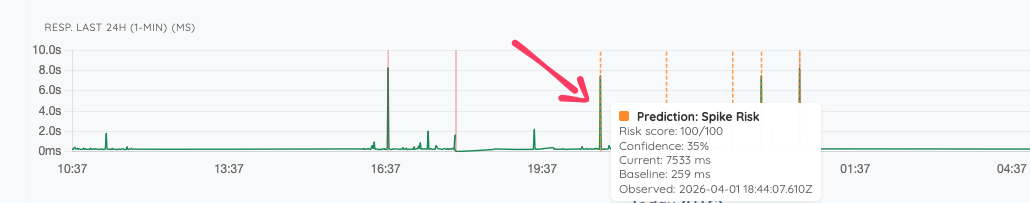
Prediction events on the graph
When a prediction alert fires, you’ll see a new orange-dotted line on the monitor’s response time graph for that check, labeled “Prediction: Spike Risk” or “Possible downtime: sudden spike,” with the necessary details related to that prediction event.
This gives you visual context for when the warning occurred relative to the response time trend.
Notification Cooldown
To avoid repeated pings during a degradation event, alerts are rate-limited per monitor. The default cooldown is 15 minutes and applies to both degradation and spike alerts. You can change this in the monitor’s Down Prediction Alerts settings (1 minute – 24 hours).
After the monitor goes down and recovers, the analysis window is reset so the first checks after recovery start fresh rather than inheriting pre-downtime slow samples.