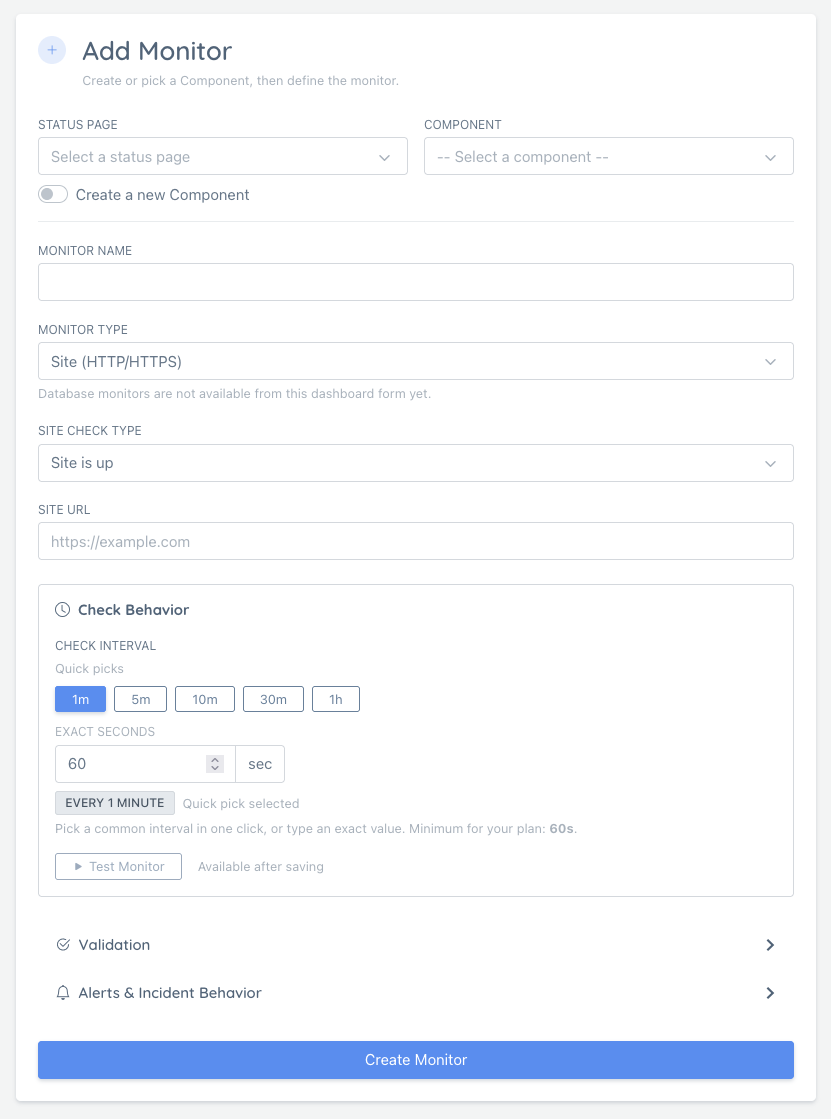
Setting Up Your First Monitor
Last updated: 2026-07-19
Monitors check your websites and services regularly to make sure they’re working. When something goes down, you’ll get notified right away.
Step 1: Navigate to Add Monitor
From your dashboard, go to Monitors in the left menu, then click Add Monitor.
You can also click the Add Monitor shortcut button on your dashboard.
Step 2: Choose Monitor Type
Select what type of service you want to monitor:
| Type | Best For | Example |
|---|---|---|
| Site | Websites and landing pages | https://www.example.com |
| API | Health checks and JSON endpoints | https://api.example.com/health |
| DNS | Domain resolution and record checks | example.com |
For most users, Site is the right starting point.
Note: Database appears in the dashboard as a future monitor type, but it is not available from the Add/Edit Monitor form yet.
If you ever open an older database monitor from the dashboard, its existing settings may still be shown for reference, but you cannot update that monitor from the current Edit Monitor form.
Step 3: Enter Your URL
Type in the full URL of your website or service:
https://www.example.com
Make sure to include https:// or http:// at the start.
As soon as you enter a valid Site or API URL, the form can probe the endpoint and show a small preview badge with status code, response time, and content type. If the response looks like JSON, the validation section can also suggest JSONPath-based conditions automatically.
For API monitors, request customization now lives in Advanced Request Settings. If you choose POST, PUT, or PATCH, the form shows a helper directly below HTTP Method. Use that shortcut to jump to Advanced Request Settings, where you can add query parameters, request headers, and a custom request body.
Closest region suggestion (paid plans)
On paid plans, as soon as you finish typing a Site, API, or DNS target, the form checks its approximate location and compares it to the primary region currently selected for this monitor. If a closer active region is available, a suggestion box appears below the target field:
📍 Closest region to this target: 🇬🇧 Portsmouth (~328 km).
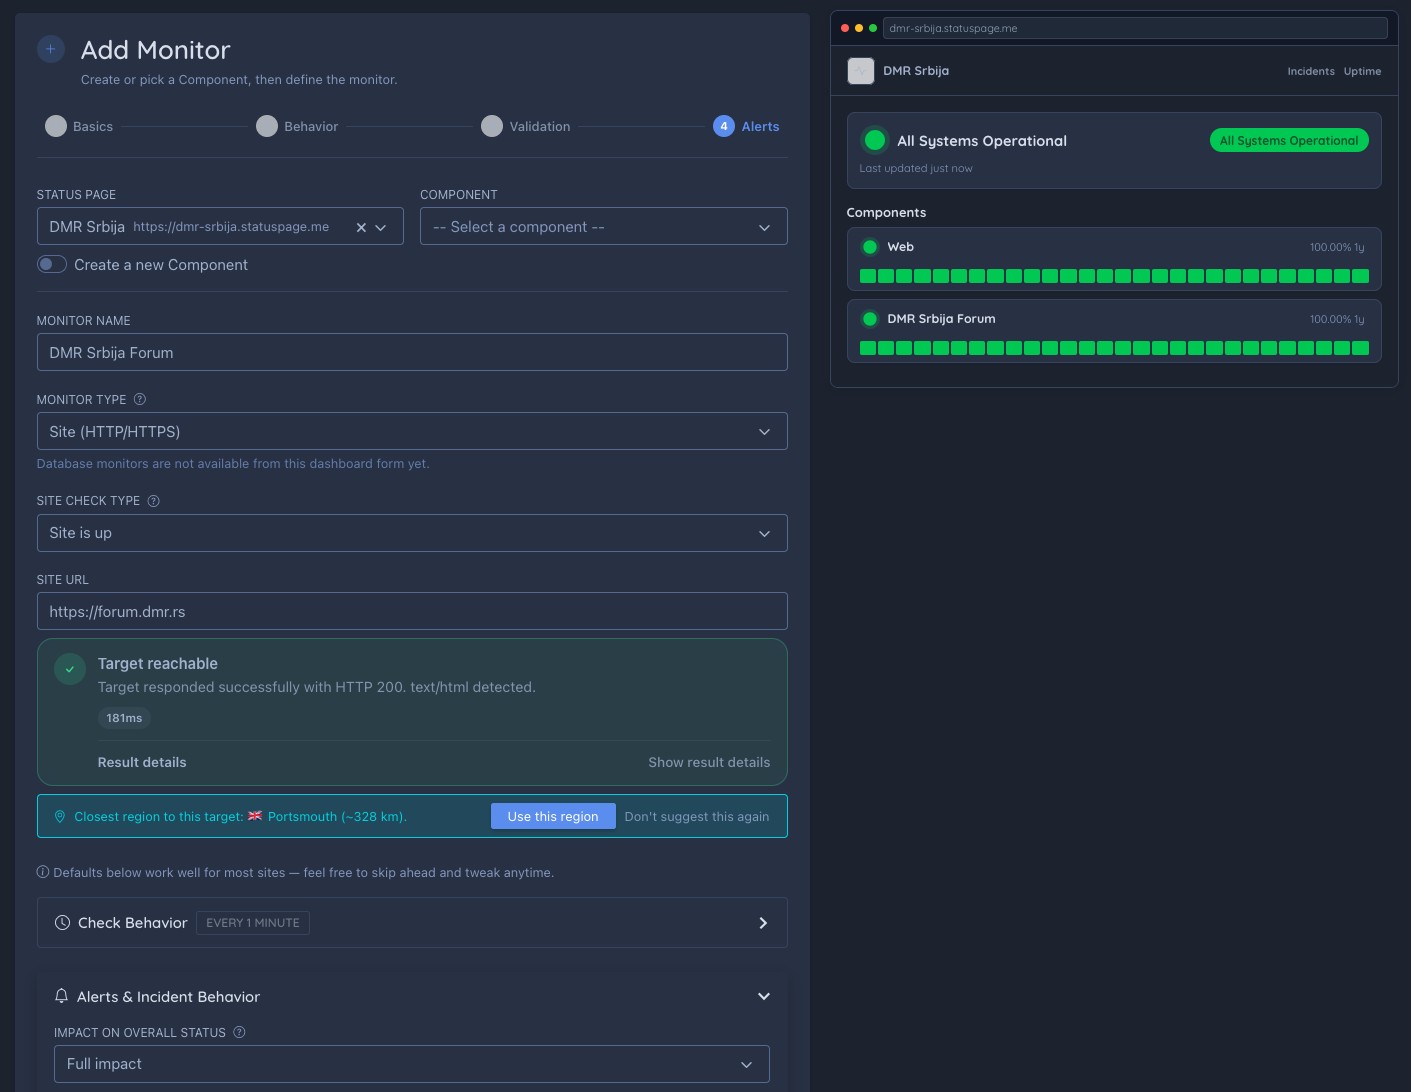
You have two options:
- Use this region — sets that region as this monitor’s primary region (and checks it in the Locations section below). This does not save the monitor yet, so you can still review or change it before submitting.
- Don’t suggest this again — turns off closest-region suggestions for your account going forward, not just for this monitor. You can still choose a primary region manually at any time.
This suggestion only appears while creating a new monitor. Free plan accounts always run from the default region and won’t see this box.
Step 4: Set Check Interval
Choose how often we should check your service. The form now gives you two ways to set this:
- Use the quick picks to choose a common interval in one click.
- Use the Exact seconds field when you want a custom interval.
The quick picks start at the lowest interval your plan allows. If none of the quick picks fit, type the exact number of seconds you want instead. More frequent checks use more of your plan’s quota, so balance speed with your needs.
If you want early warning before a monitor fully goes down, combine your interval choice with Down Prediction Alerts.
Step 5: Add Validation Rules (Optional)
If you need more than a simple uptime check, open Validation and add one or more expected conditions.
- Use Status Code when you want to require a specific HTTP code or range.
- Use JSONPath when your API returns structured JSON and you want to validate fields like
$.status = ok. - Use Response Time when success depends on latency staying below a threshold.
When the URL preview detects top-level JSON keys, click the suggested chips to add conditions faster.
For Site monitors, these conditions only take effect if you set Site Check Type (Step 2) to “Custom conditions (advanced)” — for any other Site Check Type, Validation is either hidden or ignored on save. This restriction doesn’t apply to API monitors.
Guide: Advanced Expected Conditions
Step 6: Choose Monitoring Locations (Plan-dependent)
On plans that include multiple locations, you can choose which geographic regions should check your service. Using multiple locations:
- Helps avoid false positives from network issues
- Shows you how your service performs globally
- Provides more reliable uptime data
See our monitor locations guide for details on available regions.
If this one monitor needs a different region mix than the rest of your account, use Per-Monitor Regions in the Add/Edit Monitor form.
Tip: on paid plans, you often don’t need to pick a primary region manually here at all — entering your target URL in Step 3 can already surface a closest region suggestion you can accept with one click.
Step 7: Configure Alerts and Incident Behavior
Decide how you want to be notified when something goes wrong:
- Email - Get an email when the site goes down or recovers
- Chat apps - Send alerts to Slack, Discord, Telegram, Microsoft Teams, and more
- Webhook - Send alerts to your own systems or third-party tools
You can set up notification channels in your notification settings.
Step 8: Choose a Status Page (or skip it)
In the Status Page dropdown, select which status page this monitor belongs to.
If you are on a paid plan, the first option is None — private monitor (alerts only). Choose this when you want the monitor to run and send alerts without appearing on any public status page. Private monitors count against a separate standalone quota (floor(monitors per page / 3) for your plan).
You can assign a private monitor to a status page later in Edit Monitor.
Guide: Private (Standalone) Monitors
Step 9: Save Your Monitor
Click Create Monitor and the monitor is saved immediately.
After the save, the dashboard runs an initial check for you. If that check cannot be completed right away, the monitor is still created successfully and you can rerun the check later from the monitors list or edit page.
If you selected a status page, you will be asked whether to show the monitor publicly on that page. Click Yes, show publicly to add it to the public view, or Not now — alerts only to keep it attached but hidden.
Viewing Monitor Results
After saving, you’ll return to the Monitors list where you can see:
- Current status (up or down)
- Response time history
- Uptime percentage
- Recent check results
On the Monitors list itself, if your monitor has multiple active regions, you’ll also see compact region status pills. Hover/focus a pill to view a popover with that region’s status and average response time for the currently selected range.
If a monitor is noisy or shouldn’t impact your public reliability stats, use Impact on overall status in the Add/Edit Monitor form. For example, set it to Low impact (caps outages to degraded) or No impact (excludes it from overall + uptime rollups).
Guide: Monitor Impact on Overall Status
If you share monitors on a public status page, you can optionally show a small monitor type badge (like API, DNS, or Site) before each monitor name. Enable Show Monitor Type Badges (API/DNS/Site) in your status page settings.
Pausing or Resuming from the Monitors List (Compact View)
On Monitors in compact view, use the row action icons to quickly control monitor state:
- Click Pause to disable checks for that monitor.
- Click Resume to re-enable checks.
The action runs inline (no full page refresh). You’ll see a progress overlay while the action is being applied.
After you resume a monitor:
- It moves from Disabled to Enabled immediately.
- Tab counters update automatically.
- You may briefly see Restarting… while the monitor warms back up.
How often checks run after resume
Your monitor keeps the check frequency you selected in its settings.
- If your monitor is set to 30 seconds, it continues checking about every 30 seconds.
- If it is set to 1 minute, it checks about every 1 minute, and so on.
After you click Resume, there can be a short wait before the first new check appears. This is normal. Once the monitor is active again, it follows your chosen frequency.
Note: Enable/disable is handled from the monitor row action icons in compact view.
Clearing Monitor History
If your monitor is correctly configured but has accumulated test results or old data you no longer need, you can wipe its check history without deleting the monitor:
- On the Monitors list, click the ⋯ (more actions) button on the monitor row.
- Select Clear history and confirm.
This removes all raw check results, aggregations, and resets uptime stats. The monitor itself, its configuration, and alert channels are not changed. Checks continue immediately after clearing.
Use this when switching from testing to production, after a major infrastructure migration, or any time the historical data no longer reflects your monitor’s current reality.
Guide: Clearing Monitor History
Deleting a Monitor
If you no longer need a monitor, you can permanently delete it from its edit page:
- Open the monitor, then go to Edit.
- Click Delete Monitor and confirm.
Deletion is permanent and removes the monitor and its historical data. While the deletion is processing, you’ll see a progress spinner with the message Deleting a monitor…, then you’ll be redirected back to your monitors list.
Editing an Existing Monitor
To change a monitor later:
- Open Monitors.
- Click the monitor’s Edit action.
- Update the URL, validation rules, interval, or incident settings.
- Save the monitor.
If you edit a Site URL, the validation preview now refreshes automatically after a short pause while you type, so suggested conditions stay in sync with the new URL.
If you edit a Database monitor that already exists, the dashboard shows that it is not editable there yet. Use that page as a reference view, not as an active edit workflow.
What’s Next?
Now that you have a monitor running:
- Connect it to a status page so visitors can see uptime
- Set up more notification channels
- Learn about monitor types for advanced monitoring
- See monitoring configuration examples for practical setups you can copy
- Use advanced expected conditions for stricter health checks
- Understand uptime and SLA reports
- Enable Down Prediction Alerts to get warned before an outage
- Clear monitor history to reset check data after testing or migration