
Command Palette (⌘K / Ctrl+K)
Last updated: 2026-08-24
Every page in your dashboard has a command palette — a single search box that finds your resources, runs common actions, and jumps to any part of the app, all without touching your mouse.
Opening it
Three ways to open the palette:
- Keyboard: press ⌘K on Mac or Ctrl+K on Windows/Linux, from anywhere in the dashboard.
- Click: click Search or run a command in the top header.
- Legacy shortcut: Ctrl+/ still works too, if that’s the habit you’re in.
The palette won’t open while you’re actively typing in another field (a form, a text area, and so on) — the shortcut is reserved for when you’re not mid-edit elsewhere.
What you see first
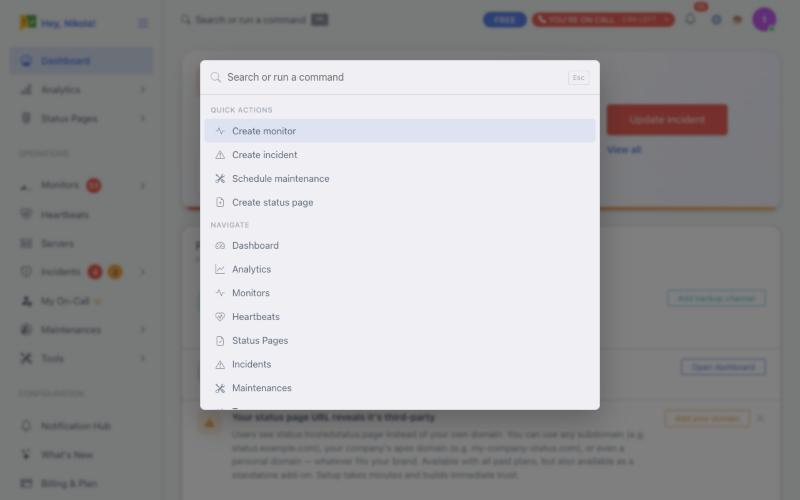
Open the palette with nothing typed yet and you get two groups, ready to use immediately:
Quick actions
- Create monitor
- Create incident
- Schedule maintenance
- Create status page
Navigate — jumps straight to Dashboard, Analytics, Monitors, Heartbeats, Status Pages, Incidents, Maintenances, Teams, Notification Hub, Billing & Plan, and Settings.
Nothing is fetched over the network at this point — the empty-state list appears instantly.
Searching
Start typing and the palette searches across:
- Status pages
- Components
- Monitors
- Heartbeats
- Incidents
- Teams
- Members
Only categories with a match are shown — you won’t see a wall of empty “No results” sections. If nothing matches at all, you’ll see a single No results for “…” message, with Quick actions still available underneath in case you want to create something instead of finding it.
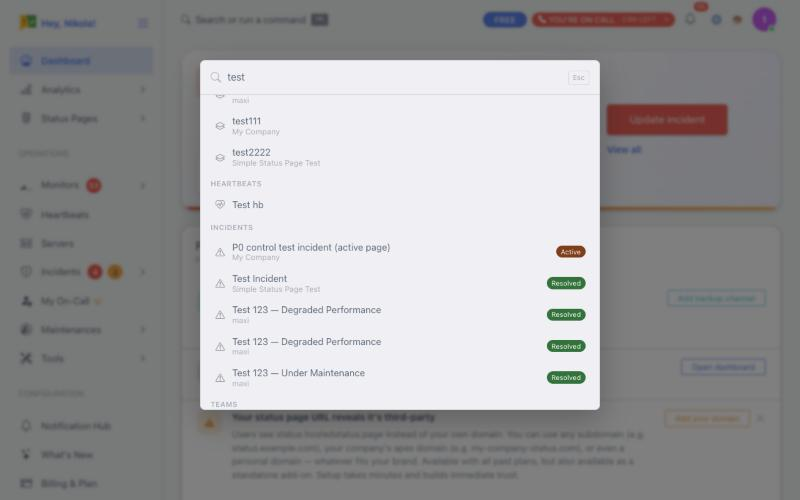
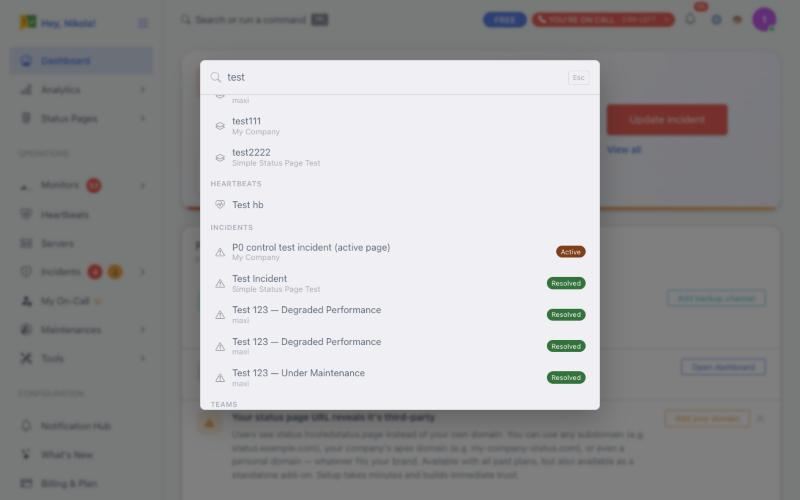
Some results carry a small status badge — for example an incident shows Active or Resolved, and a component shows its current override status if one is set.
You don’t have to type an exact name. A few shortcuts work too:
| Typing this… | …finds |
|---|---|
outage or downtime | Create incident |
maint | Schedule maintenance |
check | Create monitor |
subscription | Billing & Plan |
Personal vs. Team results
The palette always searches the workspace you’re currently viewing:
- On your personal dashboard, results and actions are scoped to your own monitors, status pages, and incidents.
- Inside a team workspace, results and actions are scoped to that team’s shared resources — the same set you’d see browsing that team’s Monitors/Incidents/Status Pages pages directly.
Switching teams (or going back to your personal dashboard) changes what the palette can find. If you can’t find something, check you’re in the right workspace first — see Dashboard Overview for how Personal and Team workspaces work.
Quick actions and Navigate links also carry your current workspace with them — picking Create monitor while inside a team takes you to that team’s monitor form, not your personal one.
Keyboard controls
| Key | Does |
|---|---|
| ⌘K / Ctrl+K | Open the palette |
| Ctrl+/ | Open the palette (legacy alias) |
| ↑ / ↓ | Move the selection up or down |
| Enter | Open/run the selected item |
| Esc | Close the palette |
Clicking with the mouse works exactly the same as using the keyboard — hovering an item selects it, clicking it runs it.
On mobile
On a narrow screen, the palette opens full-screen instead of as a floating box, so it’s still comfortable to use with one thumb. Tap the search icon in the header to open it.