
Uptime monitoring tells you that a service is unavailable. It rarely tells you why.
When an API slows down or a database starts failing, the useful evidence is often on the machine behind it: CPU pressure, memory consumption, load, a full disk, or an unexpected change in network traffic. Until now, that evidence lived somewhere separate from your monitors, incidents, and customer communication.
Servers brings it into StatusPage.me.
Install the new open-source Server Agent on a machine you operate, and its CPU, memory, swap, load, disk, and network metrics appear in a dedicated Servers dashboard. Link it through the relevant component to the exact monitor that checks a target backed by that host, and that monitor’s incidents are shown directly on the host’s metric charts.
The point is simple: when something breaks, you should not have to reconstruct the story from four different tools.
Outside-in monitoring and inside-the-host evidence
Regular monitors remain the right way to answer the customer-facing question: Can users reach the website, API, DNS record, or TCP port?
Servers answers a different question: What was happening on the host when that service started to fail?
That distinction matters. A healthy HTTP response does not prove a worker has enough memory. An external timeout does not tell you whether the database host was saturated. Both signals are useful, but they belong together when you are diagnosing an incident.
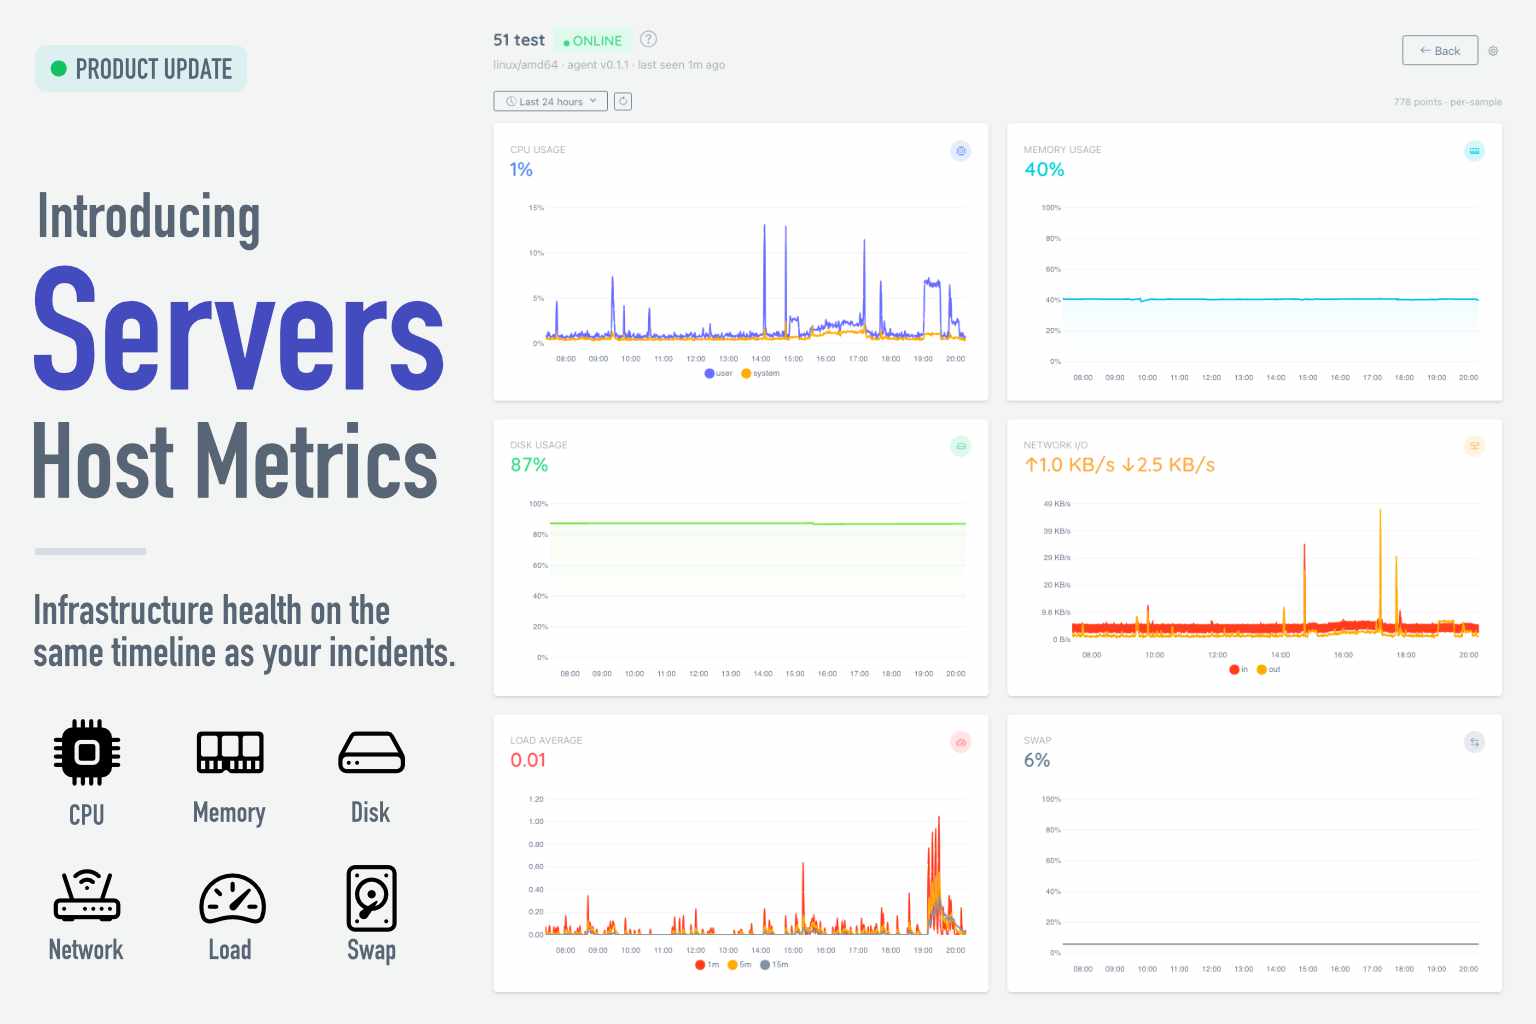
With Servers, each host has its own detail page with charts for:
- CPU utilization
- Memory use
- Swap use
- Load average
- Disk usage and I/O
- Network throughput
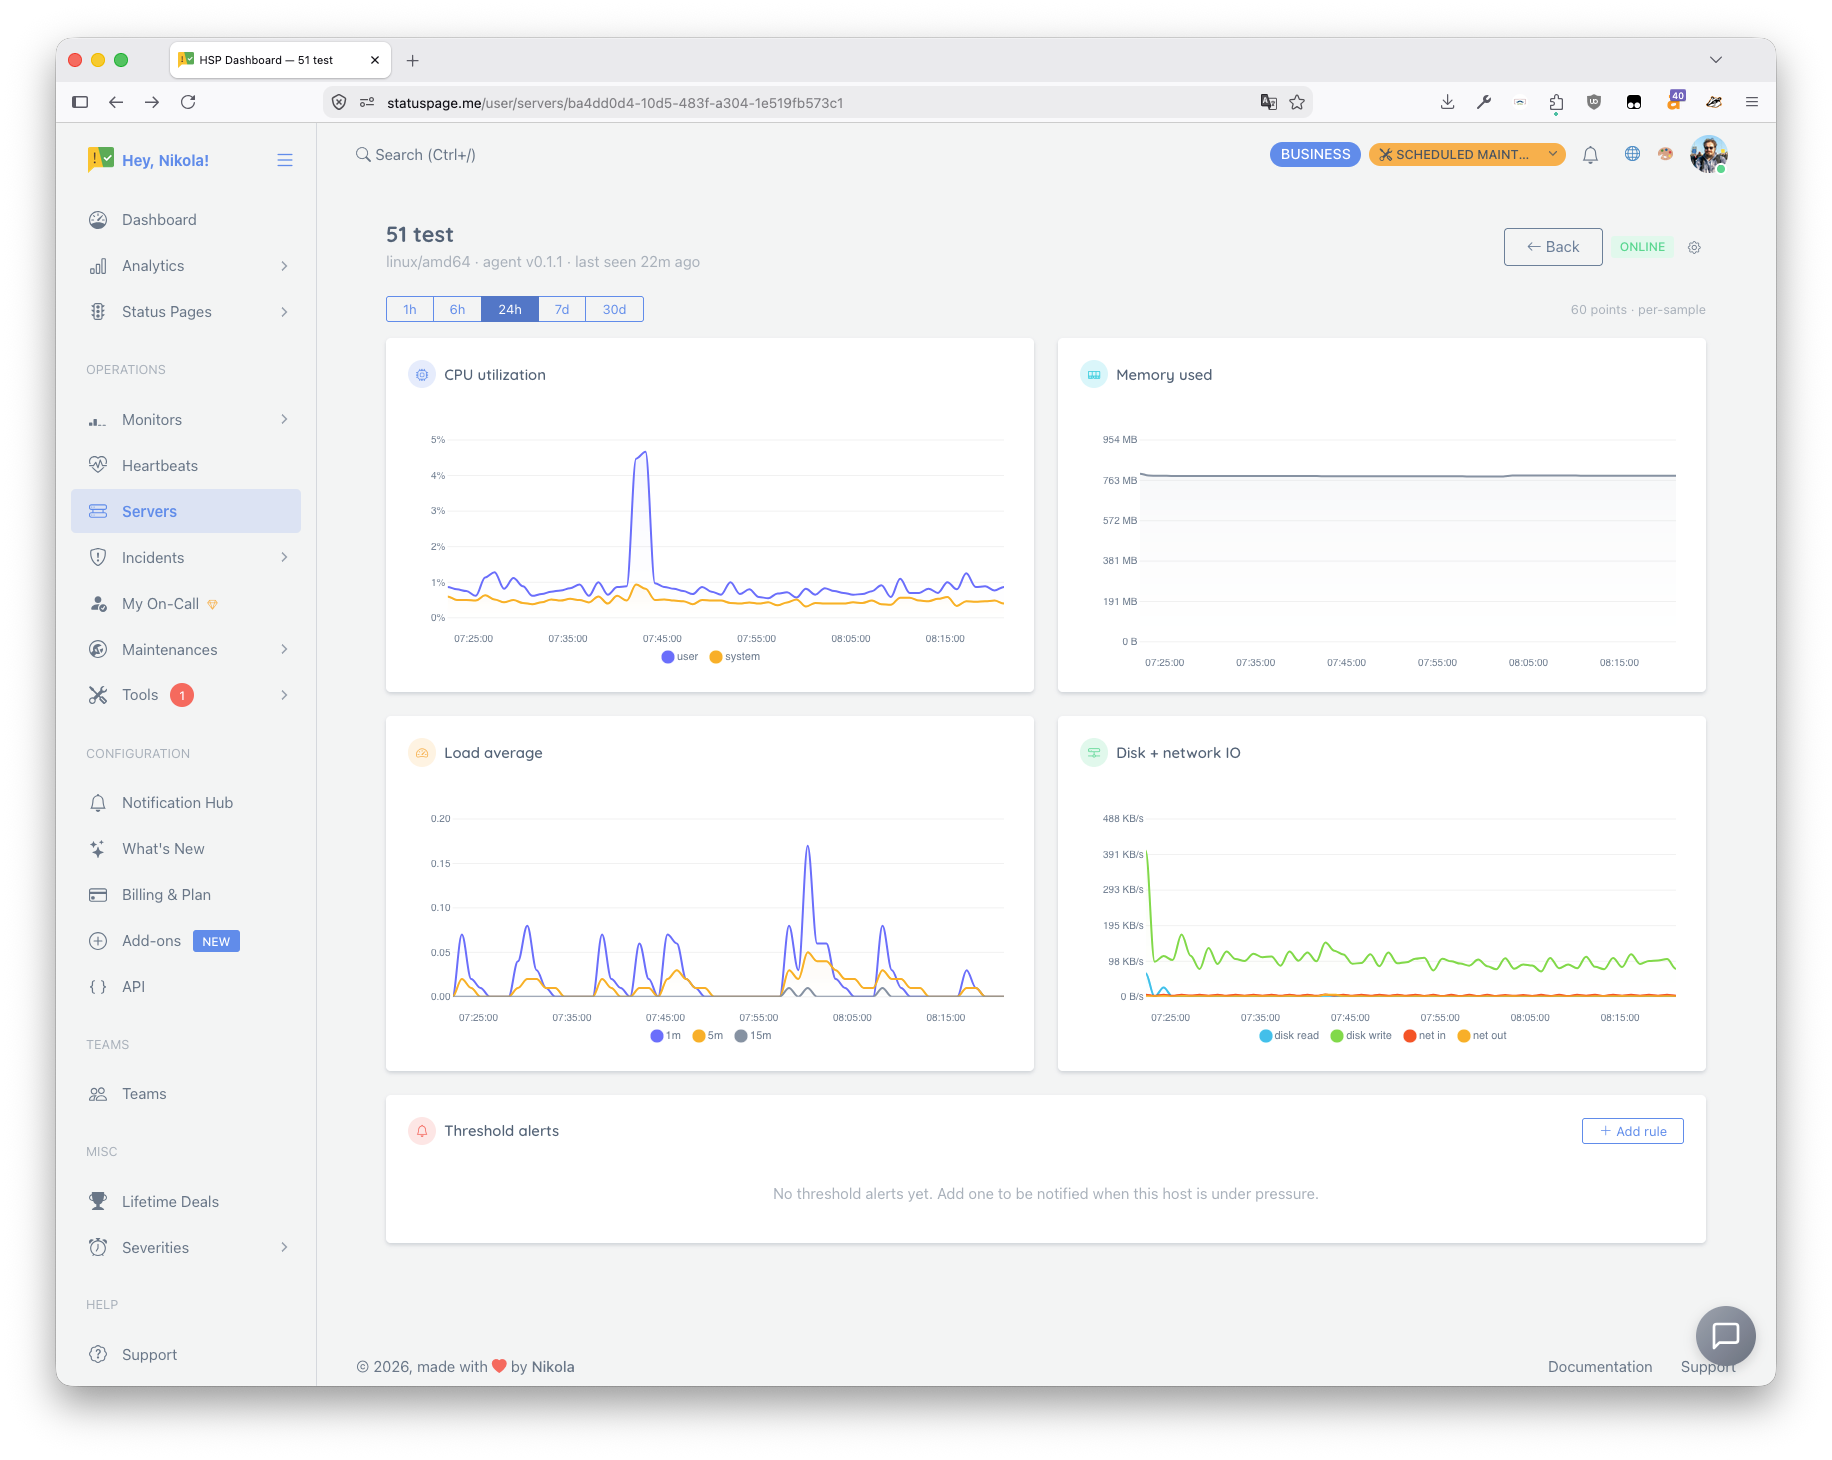
Each card shows the current value and its chart. A Recent metrics table below them brings all six signals together with their change over the last hour and a compact trend sparkline. The change is neutral: a rising number is not automatically good or bad without knowing the metric and the workload behind it.
You can choose a one-hour, six-hour, one-day, seven-day, or 30-day view, subject to your plan’s retention. When the host is explicitly linked to the monitor that checks its target, that monitor’s incident windows are shaded on those charts. That makes it much easier to answer questions such as: did load rise before the incident, did memory recover when it was resolved, or was the host completely healthy while the problem was elsewhere?
Start with one command
Go to Servers in the dashboard, create a server entry, and copy the generated installation command to the target Linux host. The agent then reports metrics over HTTPS and the first samples normally appear within a couple of minutes.
The installation key is shown once. That is deliberate: it authenticates the agent to your account and should be handled like any other production credential. If it is ever exposed, regenerate it from the server’s settings; the old key stops working immediately.
The dashboard also records a human-readable operating-system description, such as Ubuntu 22.04.4 LTS, to make a host easier to identify while you work. It stays account-scoped and is never exposed on a public status page.
The agent is open source on GitHub. You can inspect what it collects before installing it, use serveragent -dry-run to see a real sample from your machine, and use serveragent -metrics for the full list of collected and deliberately excluded data.
That last part is important. Installing software on a production server is a trust decision, not a marketing checkbox. The agent does not collect process names, command lines, environment variables, file contents, user accounts, or network peers. It does not accept commands from StatusPage.me, and it does not silently download or run updates.
Alert on sustained pressure, not every spike
For plans that include Server Agent alerts, you can create threshold rules for a host. Pick a metric, set a condition and threshold, then choose how long it must remain true before it fires.
That duration is not cosmetic. A short CPU spike during a deploy should not become an alert storm. A CPU, memory, disk, load, or network condition that stays abnormal is the signal worth routing through the notification channels your team already uses.
Threshold alerts are available on Pro and above. Free accounts can start with one host and 30 days of metric retention, so you can try the workflow before deciding whether you need a larger fleet, alerts, or longer history.
Share infrastructure health without exposing infrastructure details
Some teams want a public status page to show more than a component’s current state. They want customers to see a small, useful indication of the infrastructure serving it.
Servers supports that without turning your public status page into an inventory of your systems. On plans that include public host metrics, link a server to both a status page and a component. The page can then show an Infrastructure tile with that component’s CPU, memory, and disk percentages.
It never shows the server name, hostname, IP address, or absolute capacity. A host that has stopped reporting is removed rather than leaving stale data on the page. Incident correlation is private and requires an explicit link to the exact monitor; after choosing a component, an explicit Infrastructure toggle controls optional public host-metric display.
That separation is intentional. Customers can see a relevant operational signal, while your host identity and infrastructure size remain private.
A better incident timeline
The practical value of Servers is not another dashboard full of graphs. It is shorter, more confident diagnosis.
When an alert arrives, you can move from “the API is slow” to “the API slowed down while the application host’s memory climbed steadily for 40 minutes” without switching tools or guessing at the timeline. And if those metrics stay normal, that is evidence too: look at the dependency, the network, or the application rather than blaming the host.
Servers is available now. Start with the Server Agent guide for installation, plan limits, public visibility, and the exact metrics collected.