
Last updated: 2026-09-24
Investigating Production Host Stalls at StatusPage.me
What we learned from two periods of production instability on September 22–23, 2026
On September 22 and 23, 2026, StatusPage.me experienced two periods of production instability with an unusual failure pattern: some requests stopped completing, unrelated processes appeared to stop making progress at the same time, and then the system recovered.
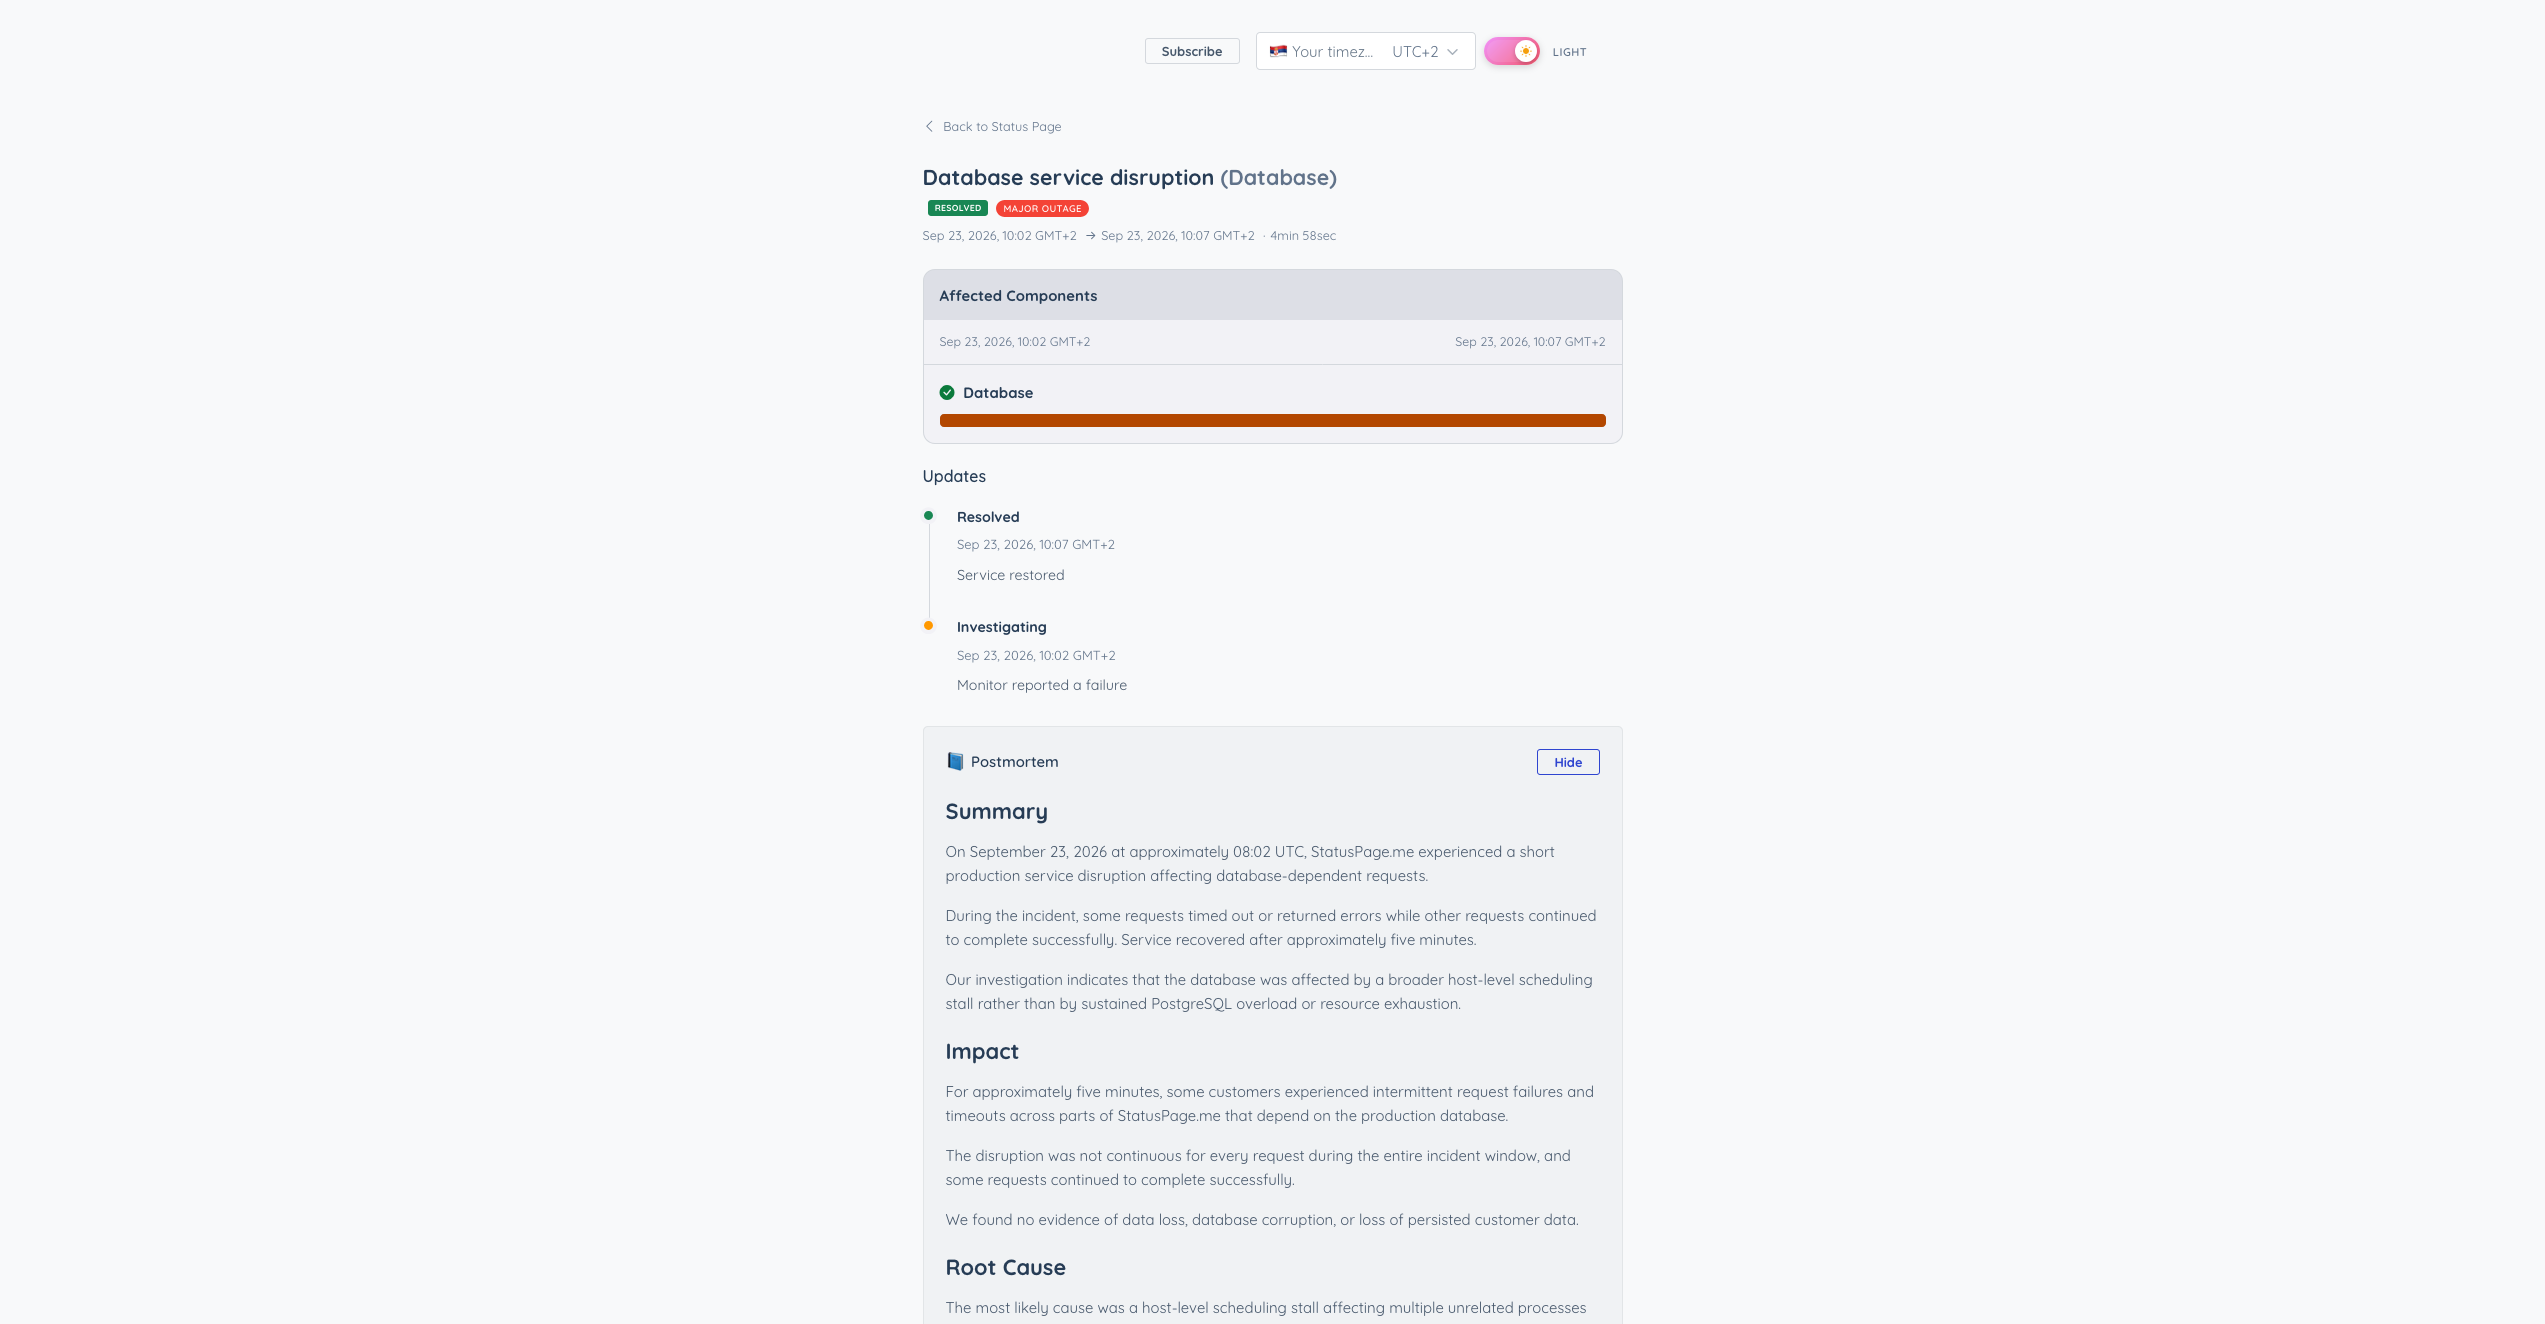
The most visible customer-facing incident happened on September 23, when database-dependent requests intermittently timed out or failed for approximately five minutes.
We published a public postmortem for that incident on our own status page:
https://status.statuspage.me/incident/ac4e11d1-649d-4f2d-8d03-8b4e82e35acf
But the five-minute database disruption was only one part of the story.
The broader investigation had started the day before and eventually took us below the application layer, into Linux kernel diagnostics and the behavior of the virtual machine itself.
This post explains what we observed, what we initially suspected, what the evidence did and did not support, what we changed afterward, and what we still do not know.
The first warning
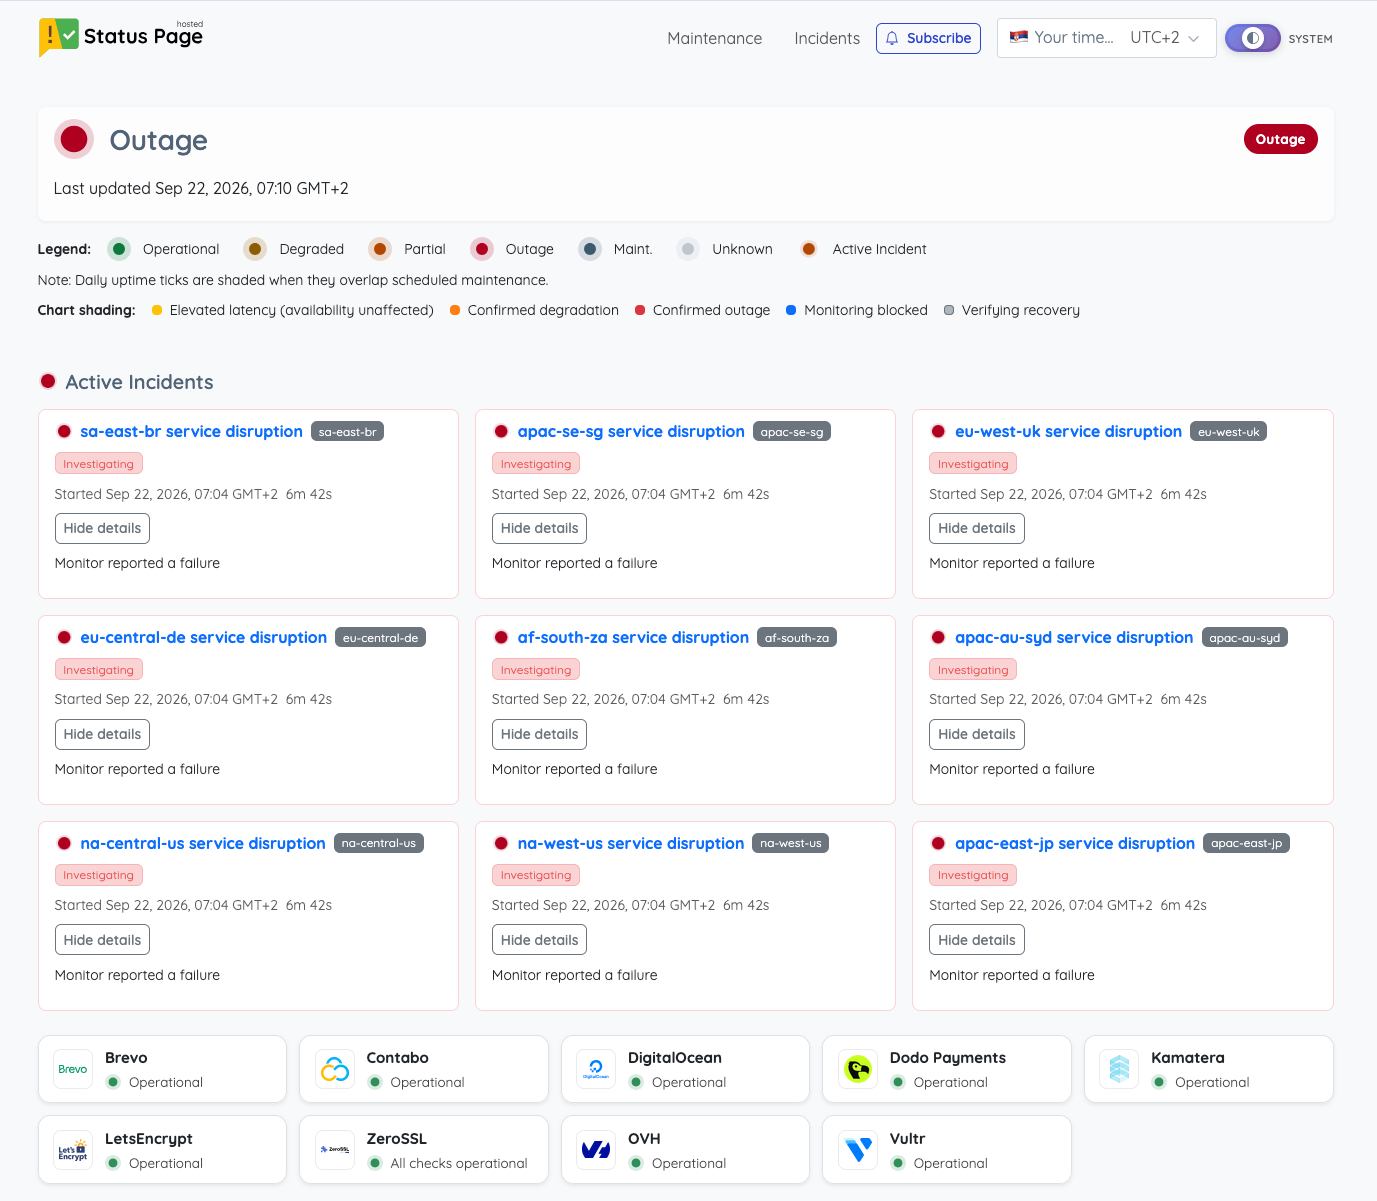
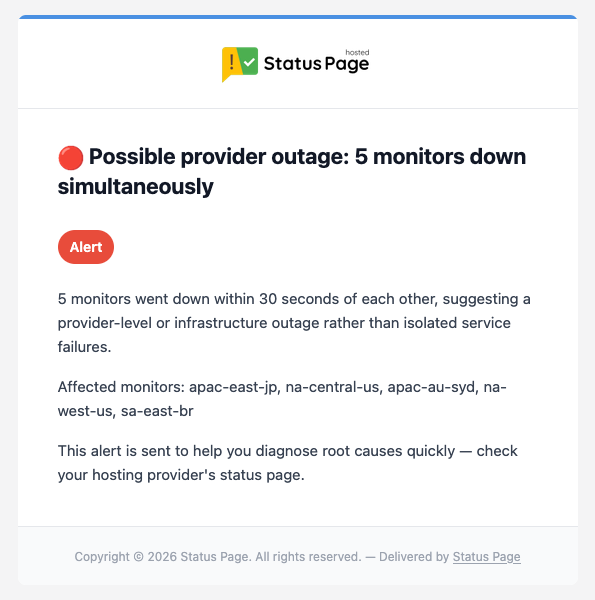
On September 22 at approximately 05:04 UTC, our automated incident system opened service-disruption incidents for monitoring components across multiple regions in Europe, North America, South America, Africa, Asia, and Australia.
That did not mean all of those monitoring regions had independently failed.
They were independent observers reporting difficulty reaching the same production service.
That geographic spread became an important clue during the investigation. A single regional probe or local network problem could not easily explain failures being observed almost simultaneously from locations around the world.
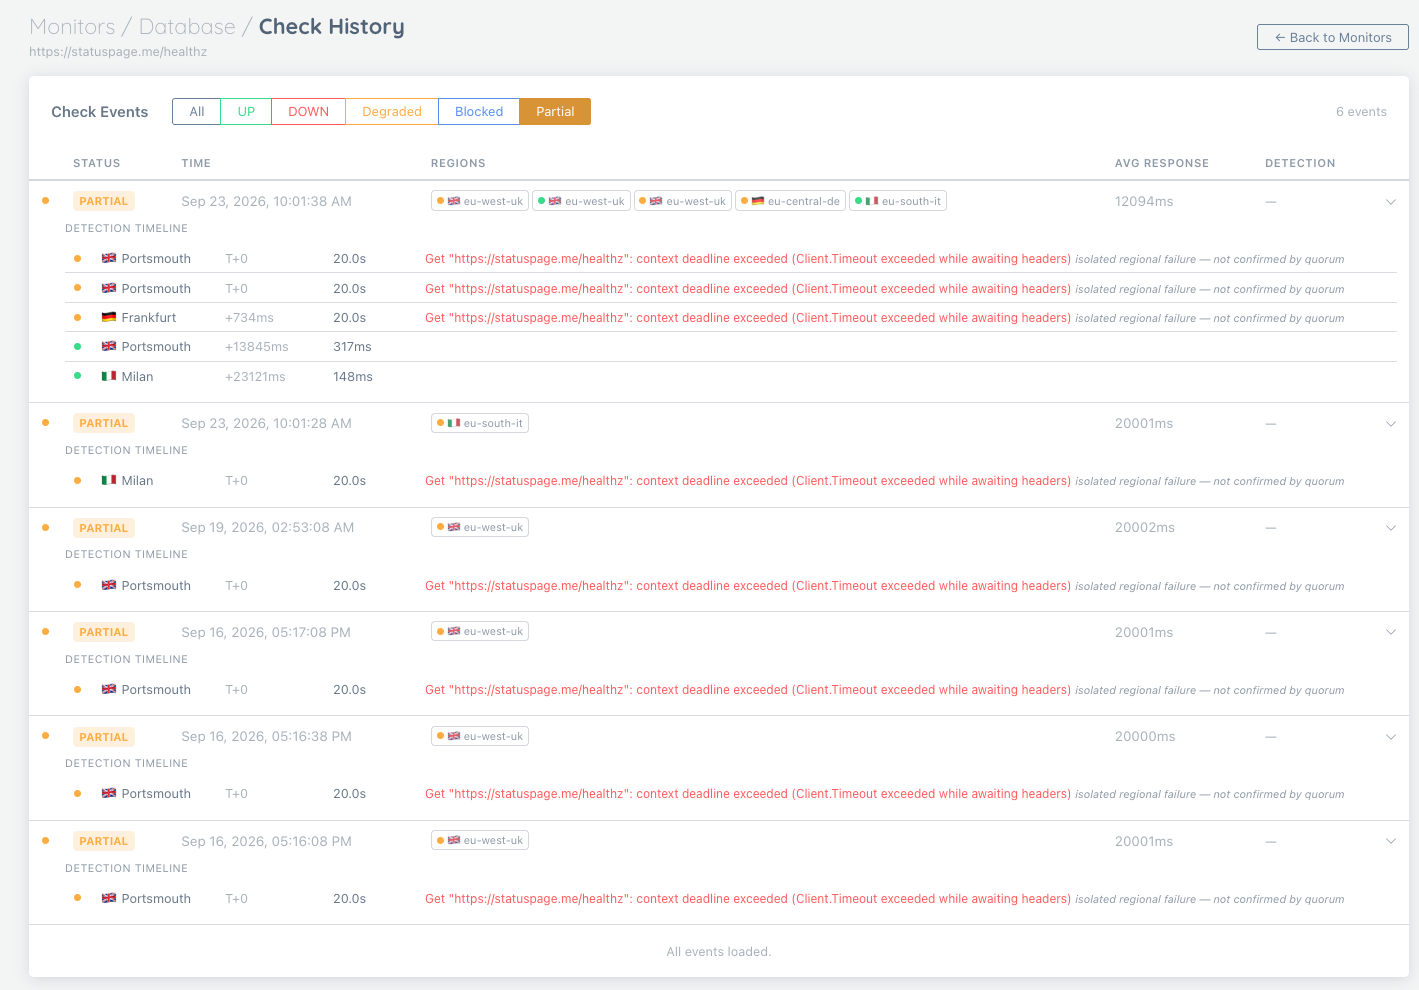
Our check history showed requests to StatusPage.me reaching their 20-second client timeout from multiple monitoring locations. In at least one event, failure quorum was confirmed in well under one second.
A second disruption the next morning
On September 23 at approximately 08:02 UTC, our automated monitoring detected another production disruption.
This time, database-dependent requests were visibly affected.
For roughly five minutes, some requests timed out or returned errors while others continued to complete successfully. Service recovered at approximately 08:07 UTC.
We found no evidence of data loss, database corruption, or loss of persisted customer data.
The incident was labelled Database service disruption because that was the customer-visible component being affected.
That distinction matters: the database service was impacted, but that does not mean PostgreSQL itself was the root cause.
The operational details are available in the public postmortem:
https://status.statuspage.me/incident/ac4e11d1-649d-4f2d-8d03-8b4e82e35acf
“Down” was not as simple as down
One of the useful outcomes of the investigation was seeing how much information gets lost when service health is reduced to a single UP or DOWN value.
During the September 23 event, some monitoring requests timed out while others completed successfully.
Our regional monitoring history therefore showed a mixture of successful and failed observations rather than a perfectly uniform outage.
That is one reason StatusPage.me uses regional observations and quorum-based confirmation instead of treating every failed probe as proof of a global outage.
An isolated regional failure is evidence.
Multiple independent failures are stronger evidence.
And missing observations are not automatically the same thing as confirmed downtime.
This incident gave us a particularly good example of why those distinctions matter.
Our first suspect was our own stack
When a database-dependent service starts timing out, PostgreSQL is an obvious suspect.
We reviewed:
- PostgreSQL activity and query behavior
- connection pool pressure
- application background workloads
- scheduler activity
- CPU usage
- memory usage
- swap activity
- disk I/O
- kernel diagnostics
There were legitimate application-level things worth investigating.
As with any production system, there are queries and background tasks capable of producing meaningful load, and we did not assume our own software was innocent.
But the evidence did not fit a normal database-overload event.
We were not seeing sustained CPU saturation.
We were not seeing sustained disk I/O pressure.
Memory usage did not indicate exhaustion.
Swap activity did not explain the stalls.
And, importantly, processes unrelated to the same PostgreSQL workload were also affected.
The kernel evidence
Kernel diagnostics recorded CPU soft-lockup and RCU-related symptoms during the broader host-stall investigation.
Multiple CPUs and unrelated processes appeared to temporarily stop making progress.
That changed the shape of the investigation.
Instead of asking only:
Why is PostgreSQL slow?
we also had to ask:
Why is the virtual machine sometimes failing to schedule unrelated work normally?
We do not have access to the hosting provider’s hypervisor-level telemetry, so there is an important limit to what we can conclude.
We cannot prove the exact physical-host failure mode.
We therefore describe the cause as a probable host-level scheduling problem rather than a confirmed hypervisor fault.
That distinction is deliberate.
A postmortem should describe what the evidence supports, not what makes the neatest story.
A useful comparison: database replication
At the same time, we were already preparing a planned migration of our production PostgreSQL workload to new infrastructure in Nuremberg.
As part of that work, we established PostgreSQL logical replication from the existing production database in Munich to PostgreSQL 18 in Nuremberg.
The initial copy moved tens of gigabytes of data and produced sustained network traffic in the tens of megabytes per second.
That is a real workload.
During the transfer, CPU, memory, disk I/O, and load remained broadly normal.
The host did not reproduce the earlier system-wide stall behavior.
That does not prove that application load was unrelated to the previous incidents, but it made the simple explanation that “the server was overloaded” increasingly difficult to support.
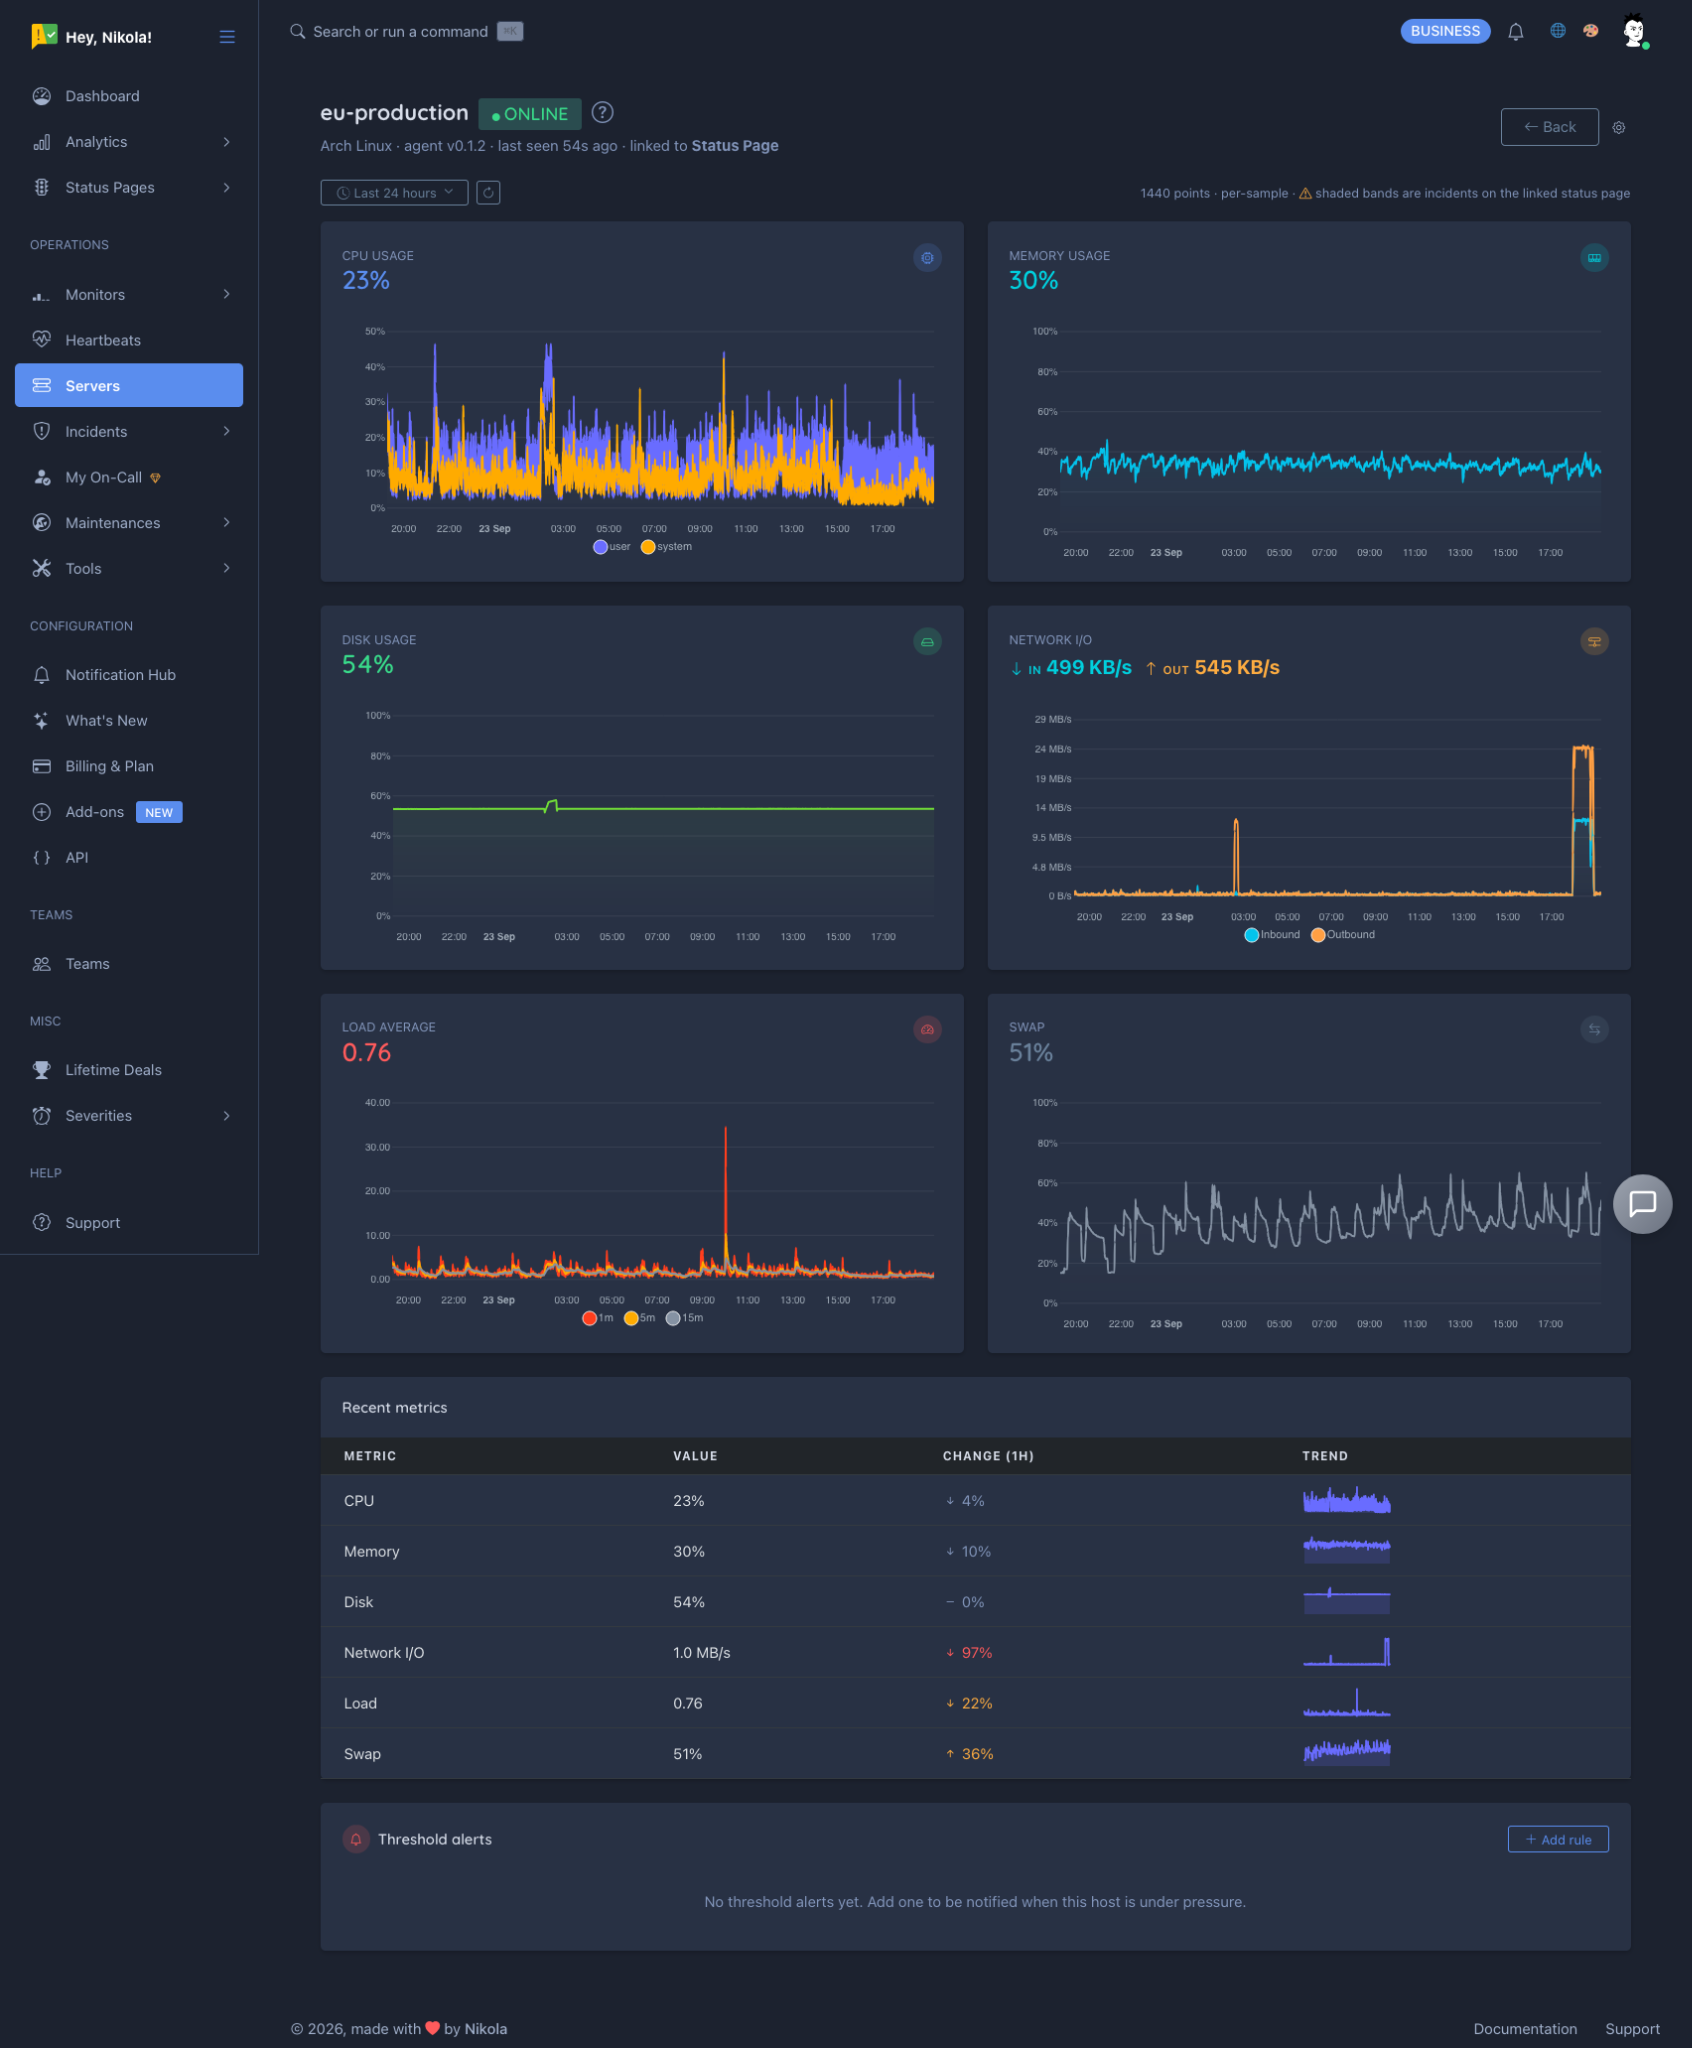
The production host sustained the logical-replication workload without reproducing the earlier system-wide stall.
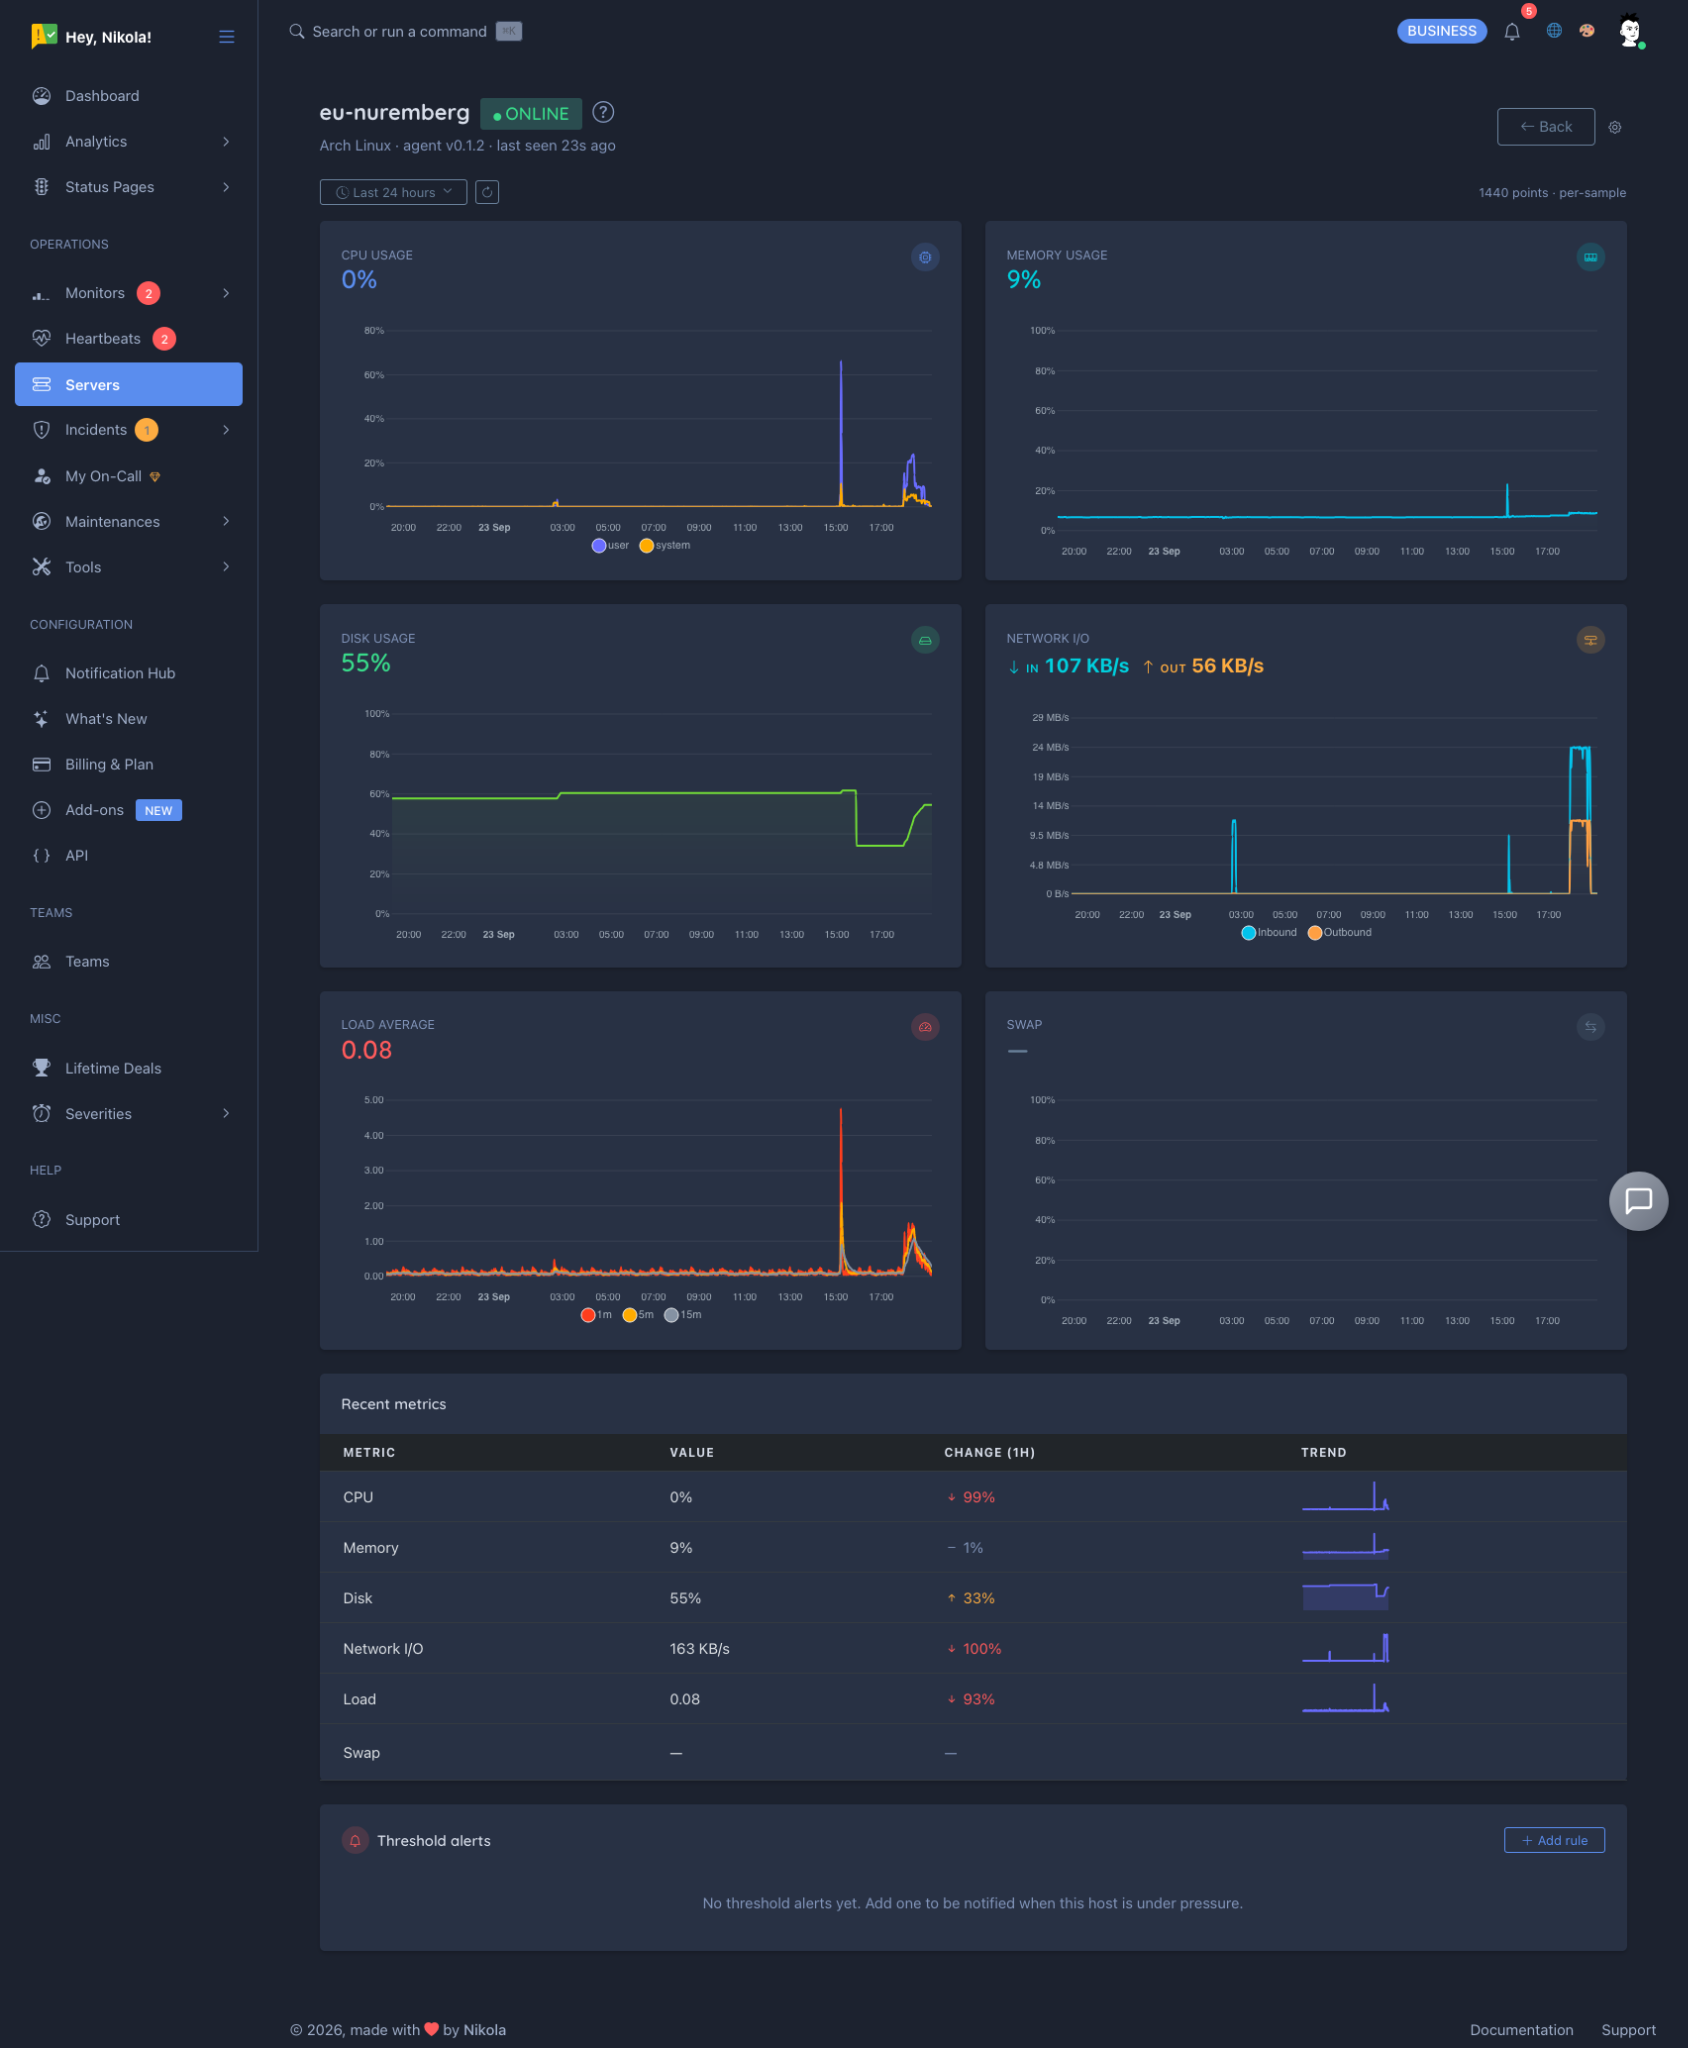
The new PostgreSQL host receiving the initial logical-replication copy.
Moving the VM
At 13:04 UTC (15:04 CEST) on September 23, our infrastructure provider completed a live migration of the affected production virtual machine to another physical host.
The guest did not need to reboot.
After the move, we verified application behavior, PostgreSQL activity, CPU, memory, load, and I/O.
We have not observed the same host-level stall pattern since the migration.
Again, that is evidence, but not proof of the precise underlying hardware or hypervisor failure.
The exact physical-host failure mode remains unknown to us.
What Contabo told us, and what it did not
We asked our infrastructure provider, Contabo, for information about the underlying cause of the host stalls.
Contabo responded operationally by live-migrating the affected virtual machine to another physical host and indicated that the performance issue had been resolved.
However, as of publication, we have not received a technical root-cause explanation describing what happened on the original physical host.
Without access to the provider’s hypervisor-level telemetry, we cannot independently determine the exact failure mode.
That is why we describe the cause as a probable host-level scheduling problem rather than a confirmed hypervisor fault.
The Nuremberg migration was already planned
The incident did not cause us to decide to move primary production from Munich to Nuremberg.
That migration was already underway.
We had announced the upcoming infrastructure change to customers almost a month earlier as part of our normal subprocessor-change process.
The September 22–23 events therefore did not trigger a reactive infrastructure move.
They did, however, reinforce the decision to complete it.
Once a production host has exhibited unexplained system-wide stalls, we do not believe it should remain in the primary production path simply because it appears healthy again afterward.
The provider’s live migration removed the original physical host from the immediate critical path.
Completing the move to Nuremberg is the longer-term step.
What we changed
The immediate mitigation was the provider’s live migration of the production VM to another physical host.
We are also continuing the previously announced production migration to Nuremberg.
In parallel, we are improving host-level monitoring and alerting so that signals such as sustained I/O wait, CPU behavior, memory pressure, and other system-level conditions are easier to correlate with application incidents.
We are also continuing work on how monitoring gaps, isolated regional failures, and confirmed multi-region failures are represented.
Missing monitoring data can be caused by deployment activity, infrastructure interruptions, or loss of observation itself.
It should not automatically be interpreted as confirmed downtime.
A product lesson from our own incident system
The September 22 event also exposed an interesting product-level behavior.
A single underlying production problem caused several automated regional component incidents to be opened at approximately the same time.
Technically, the system was reporting what each monitoring component observed.
But from a human perspective, several incidents may actually represent different observations of one underlying event.
That is a useful dogfooding lesson for us.
We are reviewing how related automated incidents can be correlated more clearly so that a common underlying failure is easier to understand without hiding the regional evidence that led to the conclusion.
What we still do not know
We do not know the precise failure mode of the original physical host.
We do not have hypervisor telemetry, and we do not want to fill that gap with speculation.
What we do know is:
- multiple unrelated processes were affected during the stalls;
- kernel diagnostics recorded soft-lockup / RCU symptoms;
- the behavior did not correlate with sustained CPU, memory, disk I/O, swap, or PostgreSQL saturation;
- independent monitoring regions observed the production disruption;
- substantial PostgreSQL replication traffic later ran without reproducing the same stall;
- the affected VM was moved to another physical host;
- Contabo did not provide us with a technical root-cause analysis for the original host behavior;
- the same stall pattern has not been observed since the live migration.
Those facts are enough for us to remove the affected infrastructure from the long-term production path without pretending we can identify a physical-host fault we cannot directly observe.
Why we’re publishing this
StatusPage.me exists to help teams communicate clearly when systems fail.
That standard should apply to us too.
We could have reduced this incident to “database unavailable for five minutes” and moved on.
That would have been simpler, but it would also have been incomplete.
Production incidents are often messy.
The first component to fail is not necessarily the root cause. Monitoring systems can observe different parts of the same failure. Some evidence is conclusive, some is circumstantial, and sometimes the exact lowest-level cause remains outside your visibility.
We believe being transparent includes explaining those uncertainties rather than hiding them behind a confident-sounding root-cause sentence.
Our public status page remains the source for operational incident updates and postmortems.
This post is the longer technical account of what happened and what we learned from it.
Timeline
| Time (UTC) | Event |
|---|---|
| Sep 22, ~05:04 | Multiple monitoring regions independently observed production-side failures and automated regional incidents were opened. |
| Sep 23, ~08:02 | Automated monitoring detected a database service disruption. |
| Sep 23, 08:02–08:07 | Some database-dependent requests timed out or failed while others continued to complete successfully. |
| Sep 23, ~08:07 | Service recovered and request handling returned to normal. |
| Sep 23, after recovery | Investigation focused on PostgreSQL activity, application workloads, memory, swap, disk I/O, and kernel diagnostics. |
| Sep 23, 13:04 | Contabo completed a live migration of the production VM to another physical host. |
| After migration | No recurrence of the same host-level stall pattern has been observed. |